
The Company Profile serves as a dedicated space that provides access to the company's marketing activities, years' worth of campaign history, performance analytics, and the tools needed to monitor its marketing efforts in one place.
The Company Profile is organized into several subtabs, each dedicated to a specific aspect of the company's activities and performance.
Here's an overview of each subtab and other essential features -- what they do and how they can help with your competitive analysis.
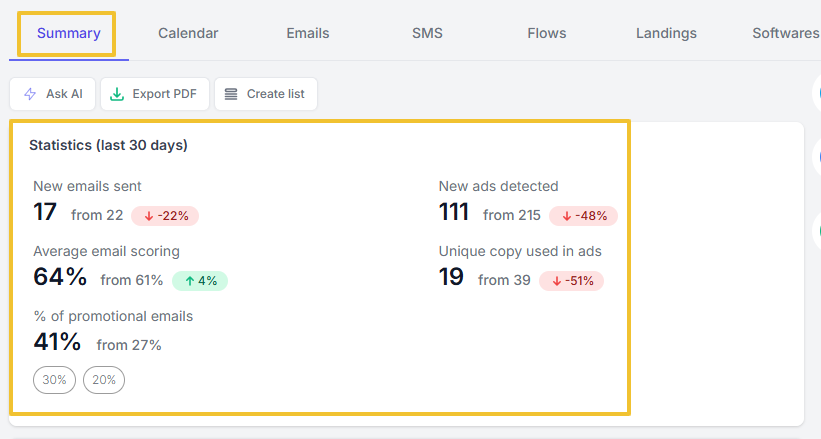
The Summary tab displays an overview of the company's recent activities and important performance metrics at a glance.
The page shows statistics for the last 30 days of email and ad activities. For instance, how many new emails were sent in the last 30 days, and their percentage performance as compared to the previous period.
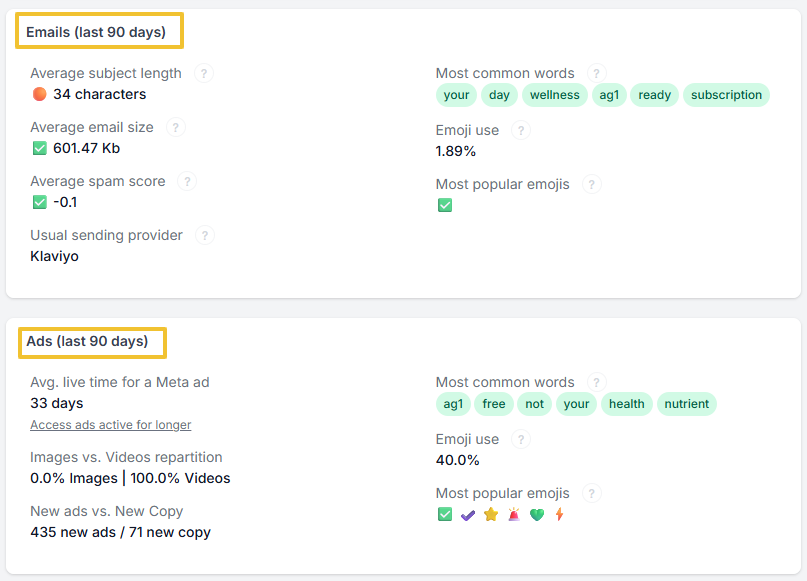
It also provides important performance metrics for the last 90 days, such as subject length, email size, spam score, emoji usage, and others, as shown in the image below:
Moreover, the Summary page shows the most recent activities arranged per category, such as Emails, Ads (per ad type and network), Messages (for SMS), Snapshots, Social Posts, and SEO Update.
There are also other helpful tools you can find on the Summary page, including Ask AI, Export PDF, and Create list.
Ask AI lets you gain AI-powered marketing insights about emails/ads strategies, campaigns, and key learnings from the company's marketing activities.
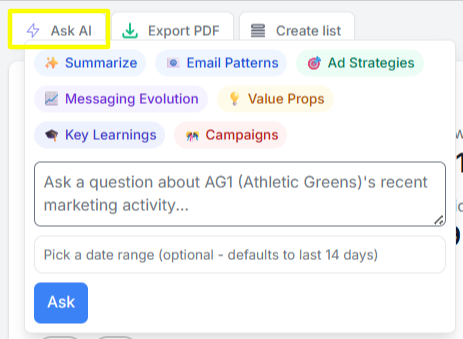
Export PDF provides a downloadable report about the company's recent updates, best practices, and recent statistics on their emails and ads.
The Create list button lets you create a static list of emails and ads within the last 30 days, with a set keyword filter.
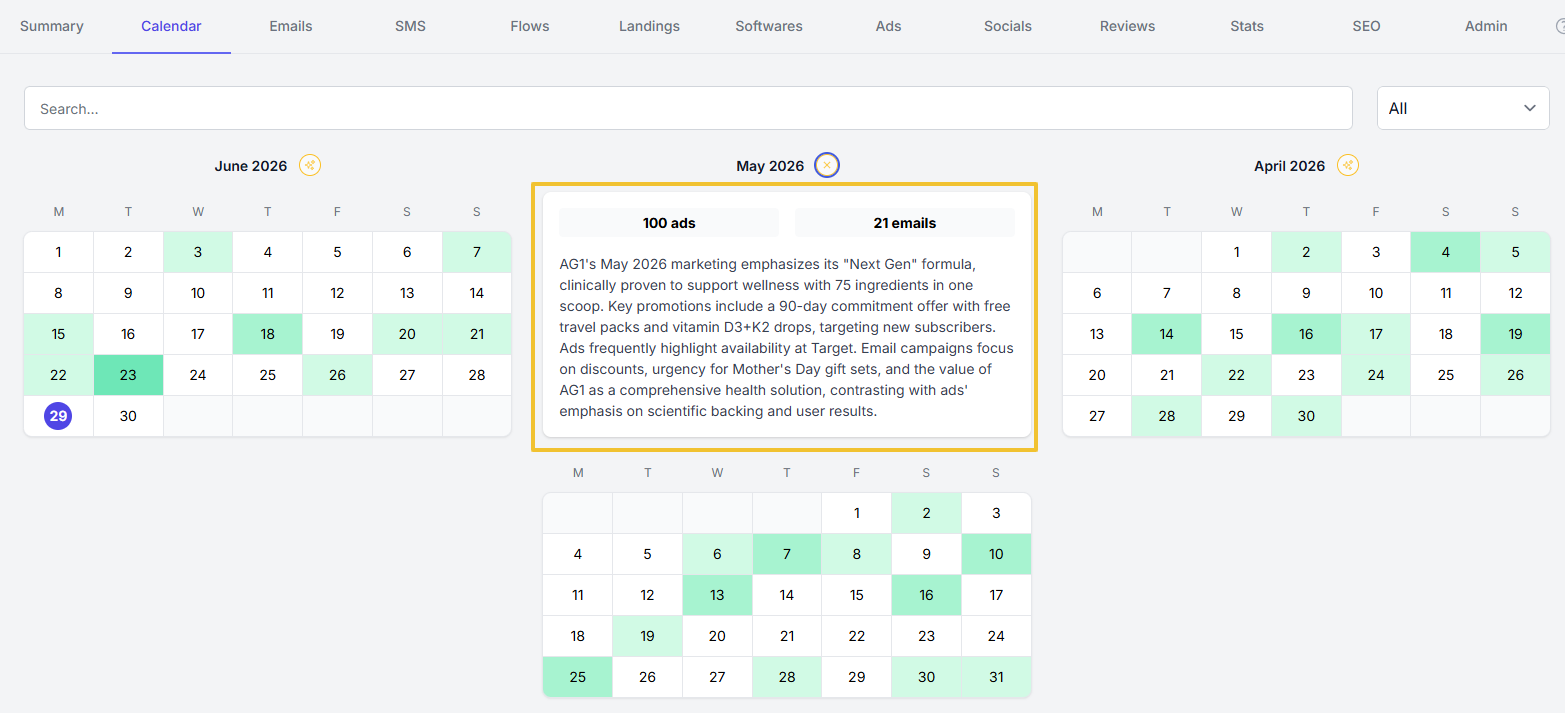
The Calendar tab provides a chronological view of a company's published marketing campaigns and promotional activities.
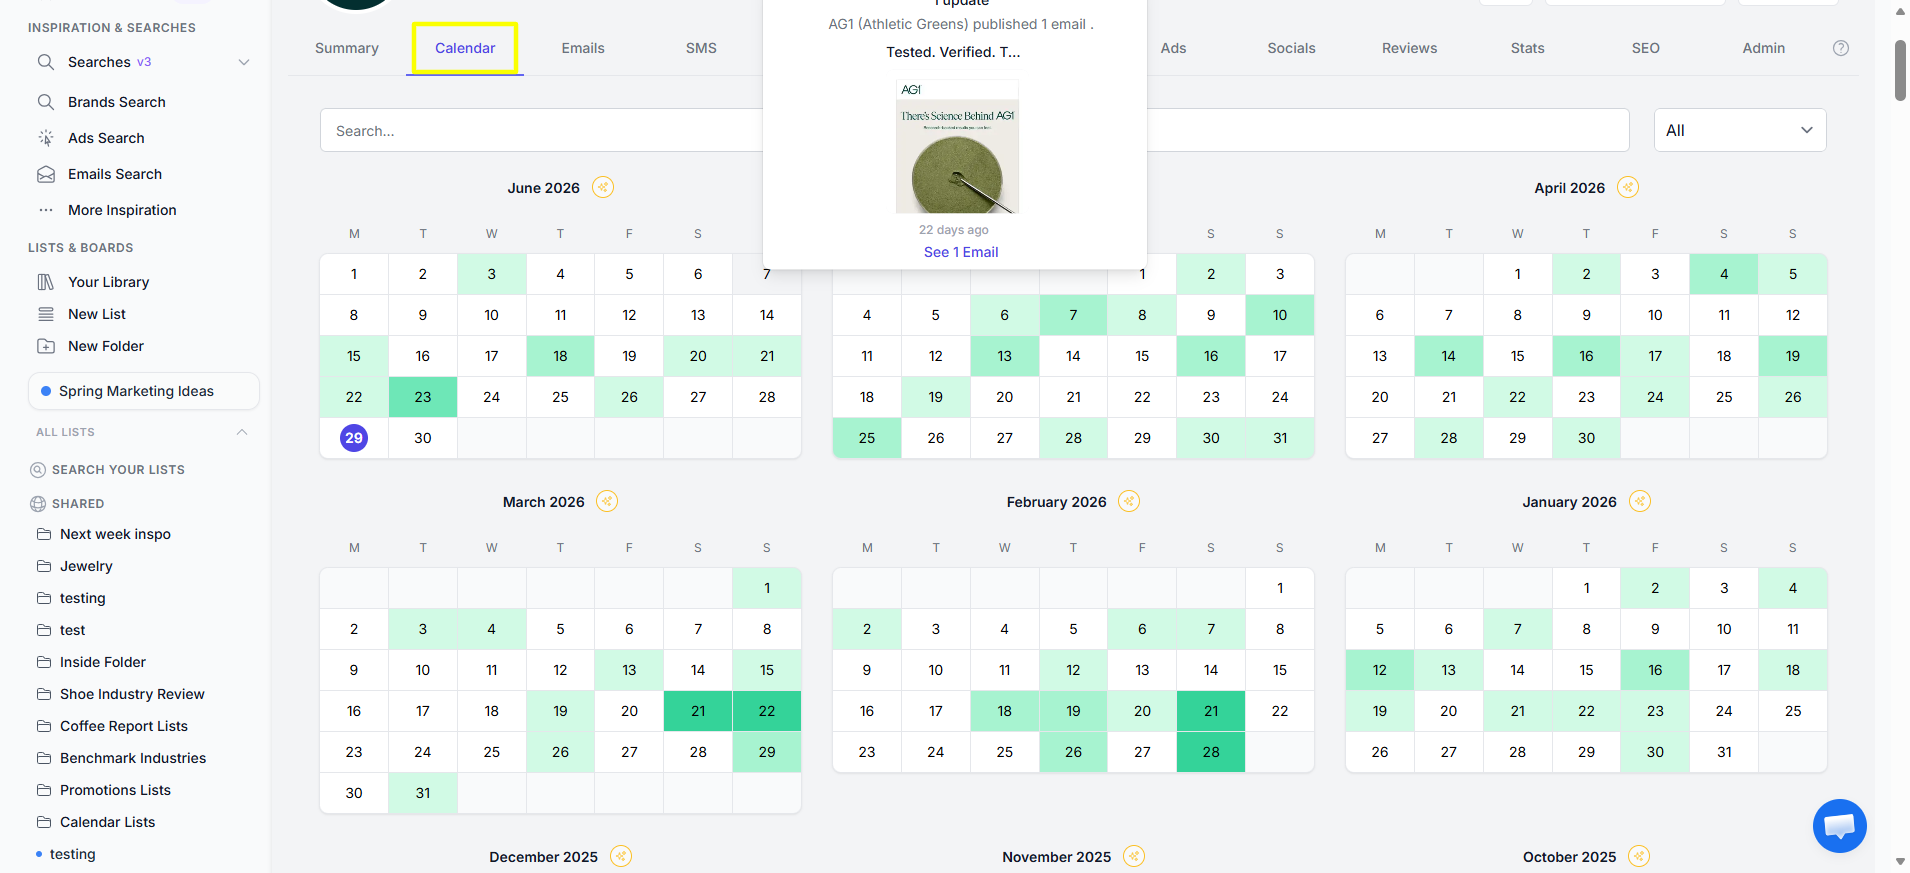
It allows you to browse campaigns by date and/or by keyword to identify when specific marketing efforts were launched and how frequently the company engages its audience.
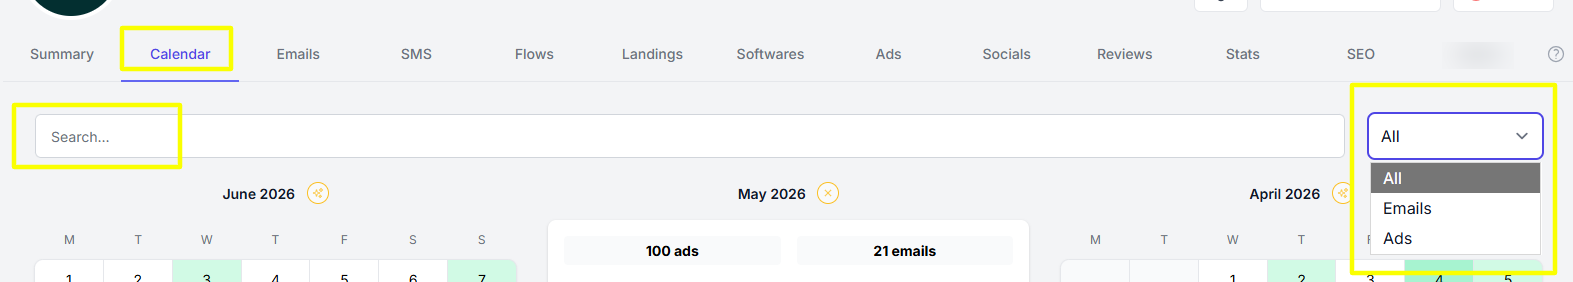
It also includes a monthly summary feature that automatically compiles and highlights a company's marketing activities for a selected month, so you don't need to review each campaign individually to identify notable marketing events.
The Emails tab displays all emails captured from a company's email newsletter subscription.
The email thumbnails are arranged by date and lead to the specific email page for the whole content of the email.
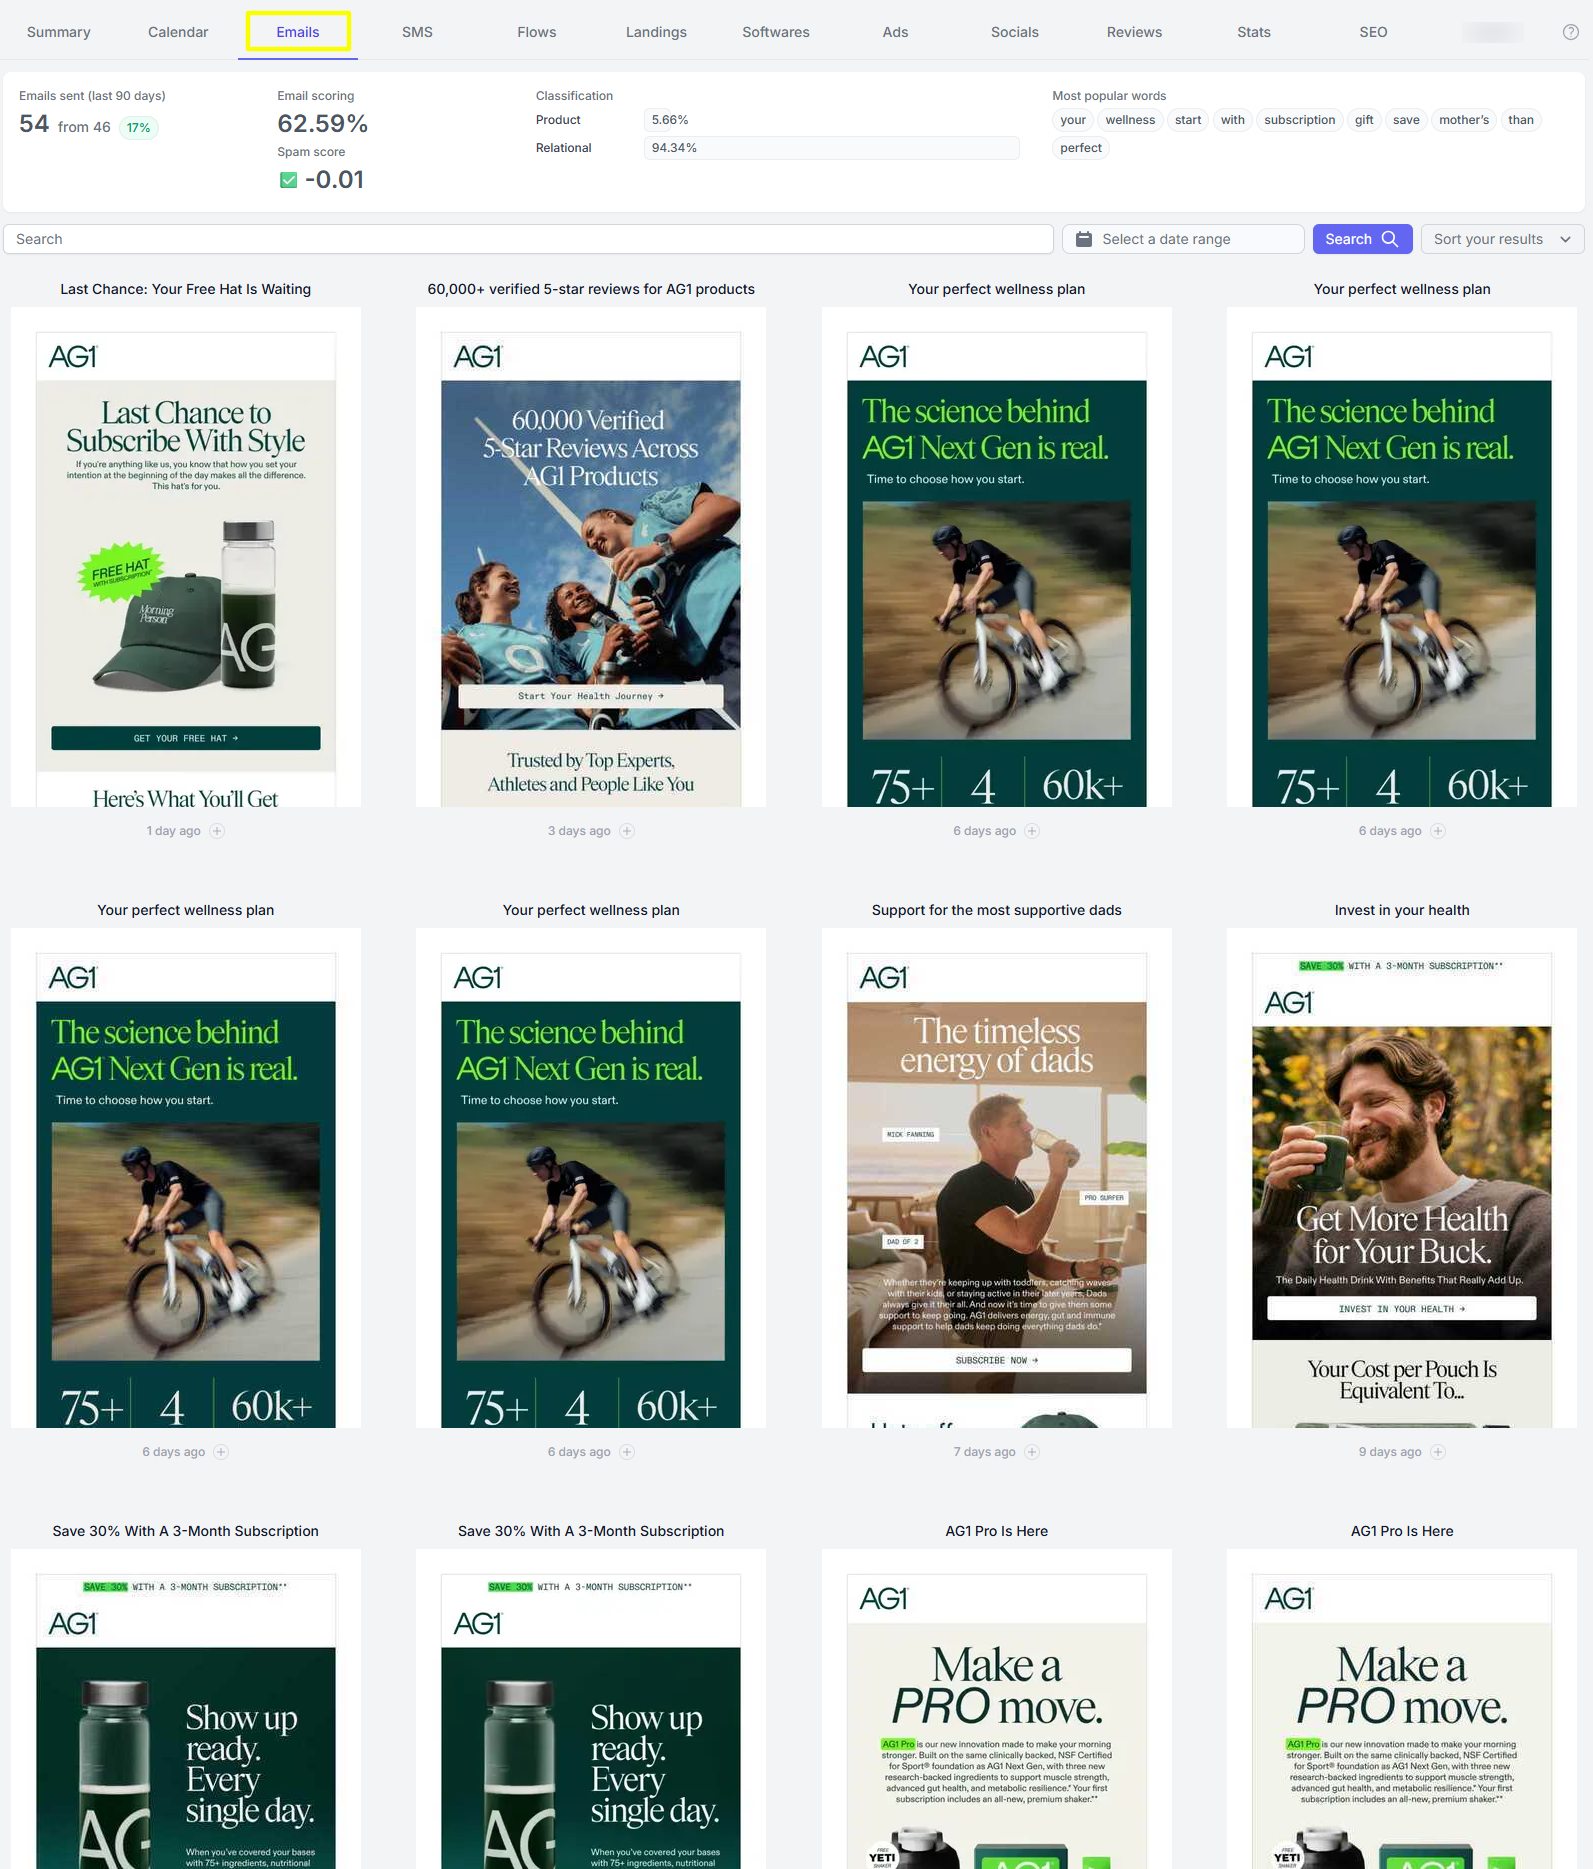
It also has an email search feature that allows you to quickly find and explore a company's email marketing campaigns. You can search for emails using keywords, subject lines, or content to locate specific campaigns without manually browsing the entire email history.
It also provides insights into a company's email marketing strategy, such as sending frequency, email & spam scoring, and email content classification.
The SMS tab lets you monitor a company's text messaging campaigns, when available.
The page displays marketing SMS messages as they would appear to the recipient's mobile phone.
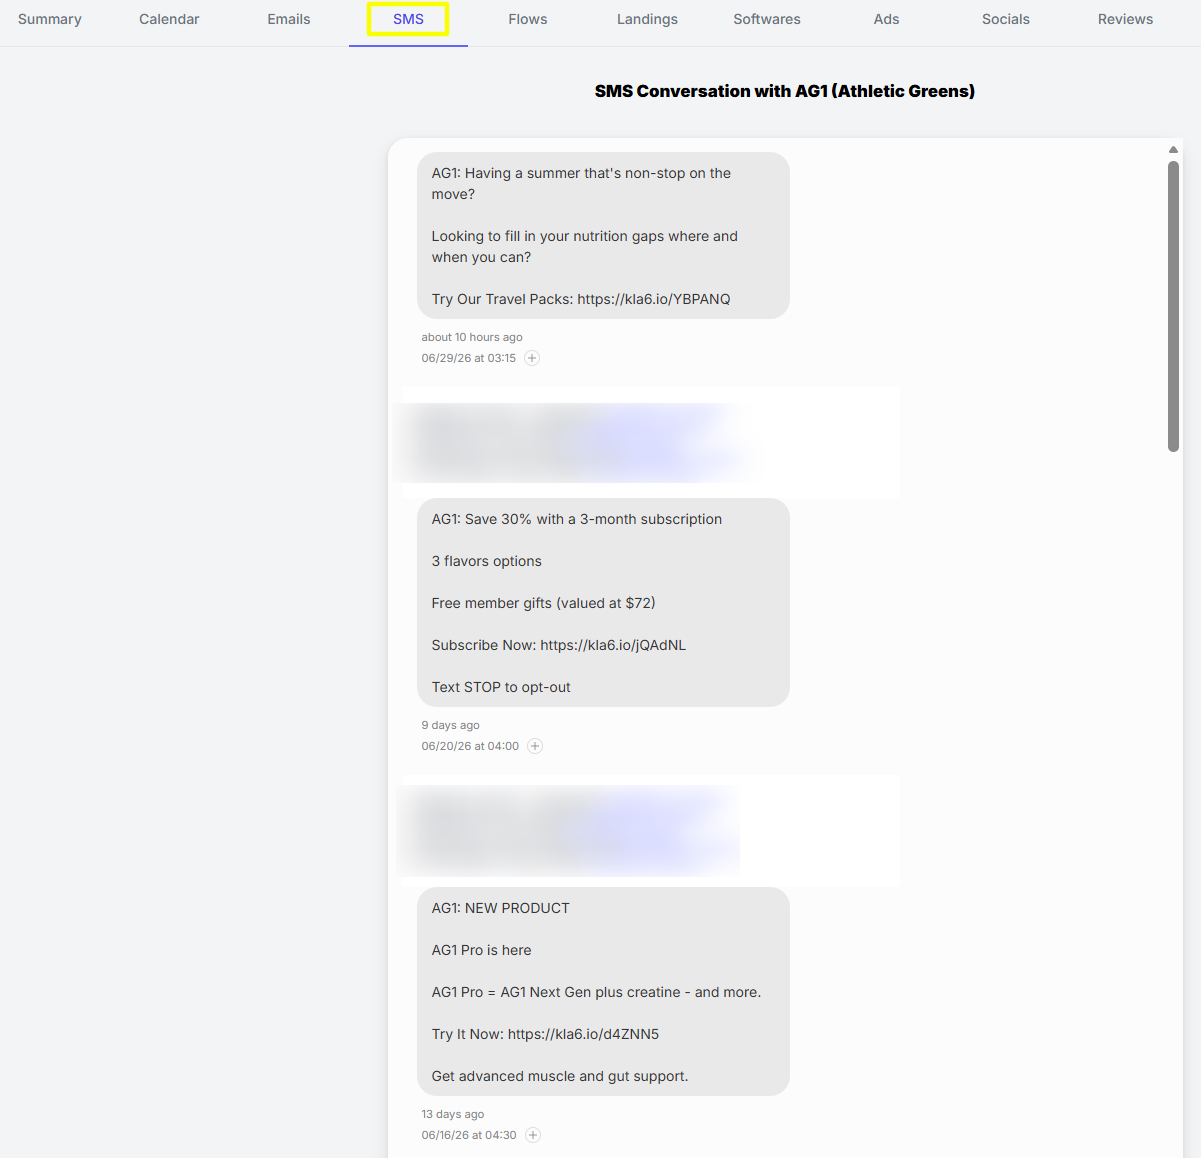
This tab makes it easy to review promotional texts, announcements, special offers, reminders, and other SMS communications.
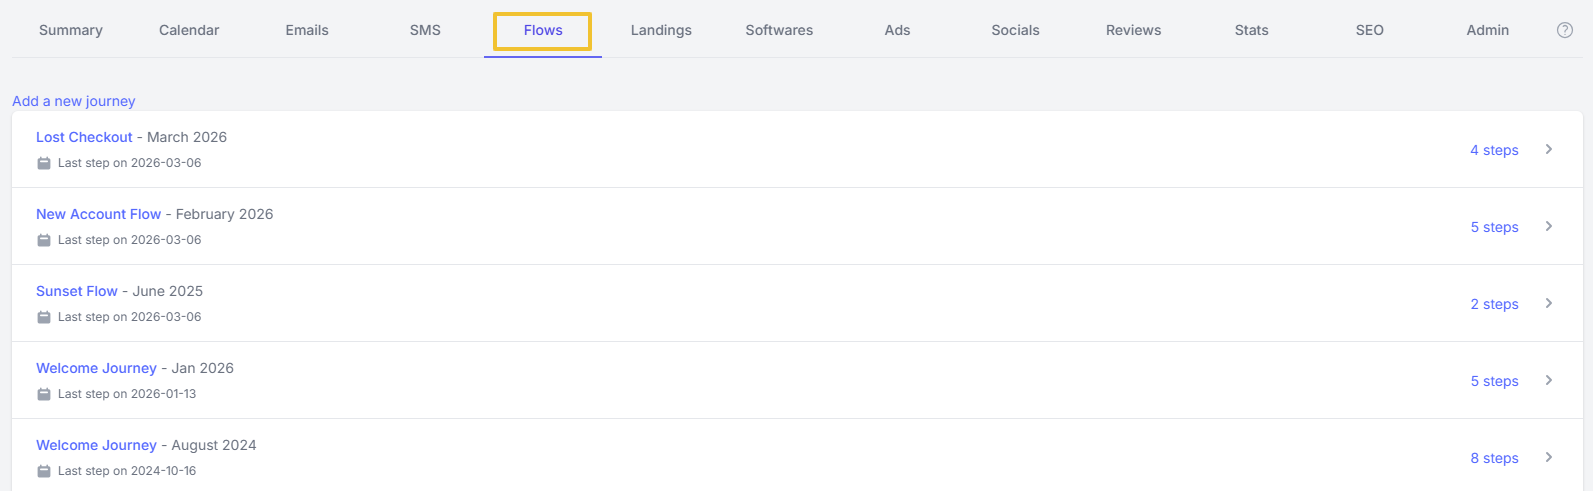
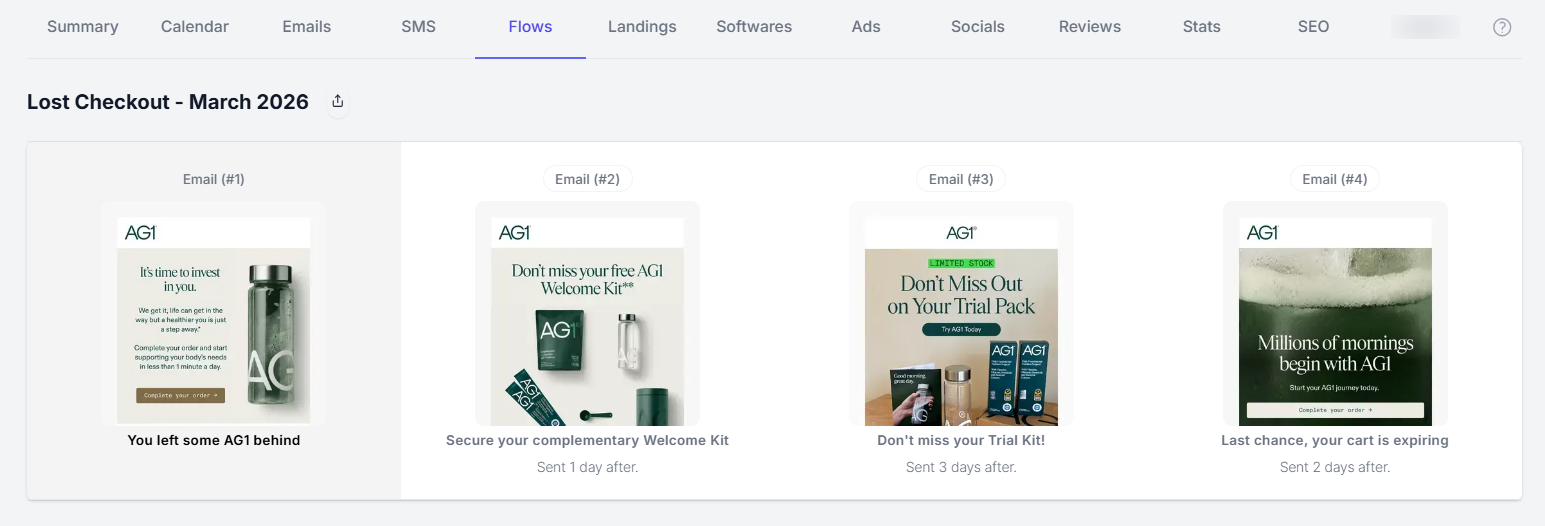
The Flows tab lets you view a company's automated email sequences. These flows consist of a series of emails that are triggered by specific customer actions or events, such as Welcome Flows, Lost Checkout & Cart Abandonment, Product Launches, and other automated marketing journeys.
It helps you better understand how the company nurtures leads, encourages conversions, and maintains customer engagement.
Here's an example of Flows from the brand AG1:
The Landings tab lets you track the key pages on a company's website, such as its homepage, featured/ best-selling product pages, and ad landing pages.
By monitoring changes to these pages, you can identify how the company optimizes its website for customer engagement and conversions.
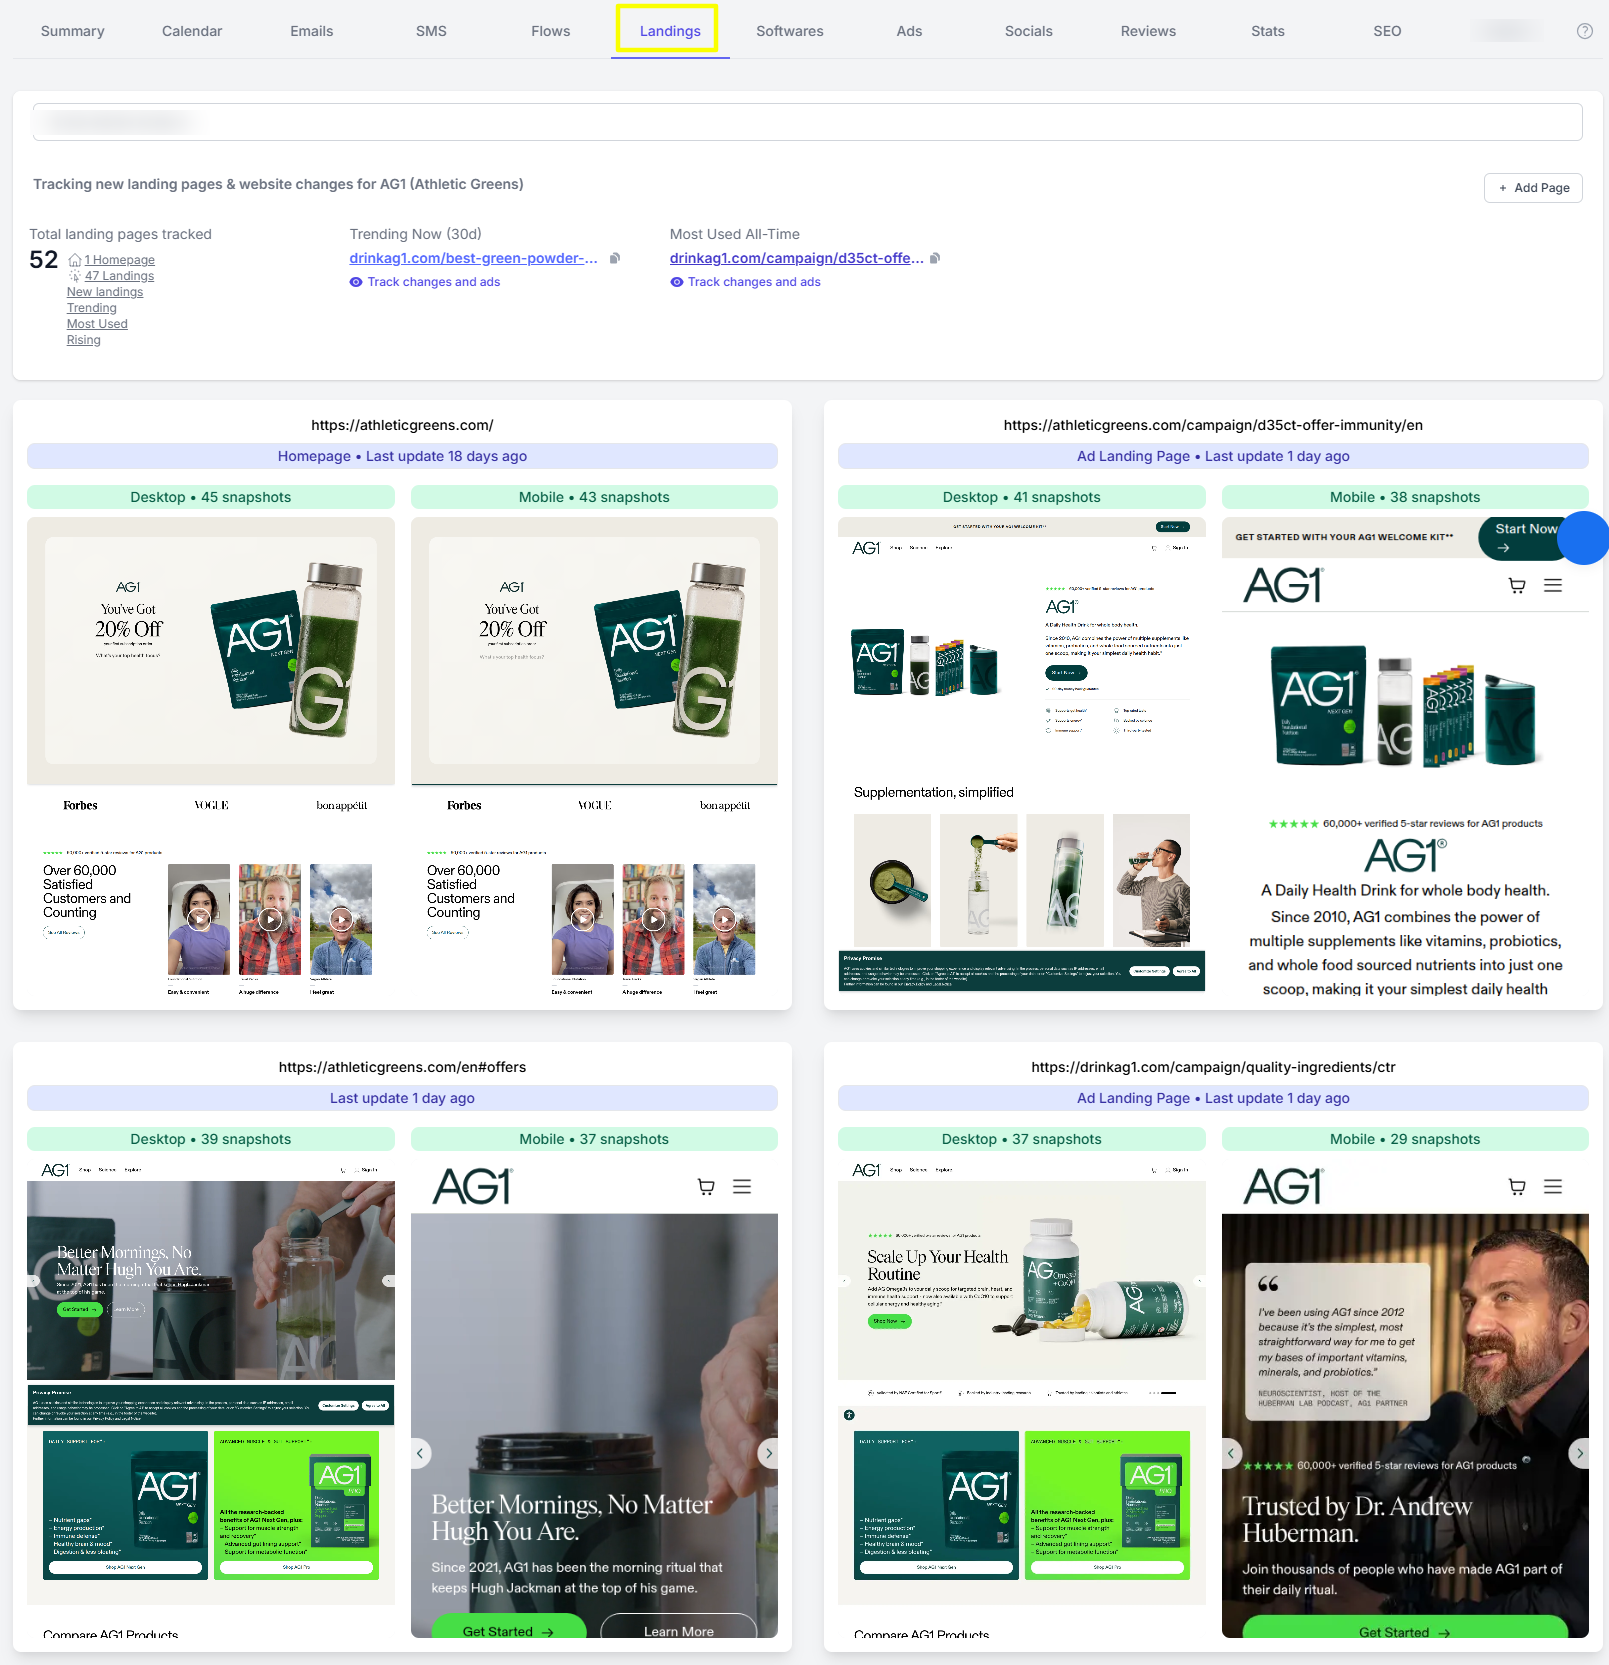
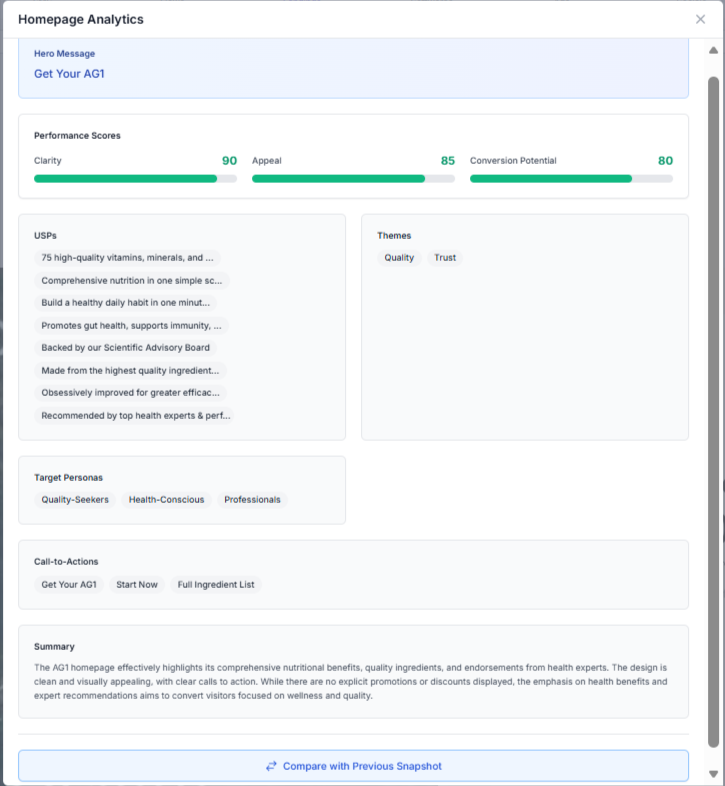
It also has the page analytics feature that helps you gain more insights into performance scores, USPs, Themes, and CTAs used, Target Personas, and even a summary of the page's content.
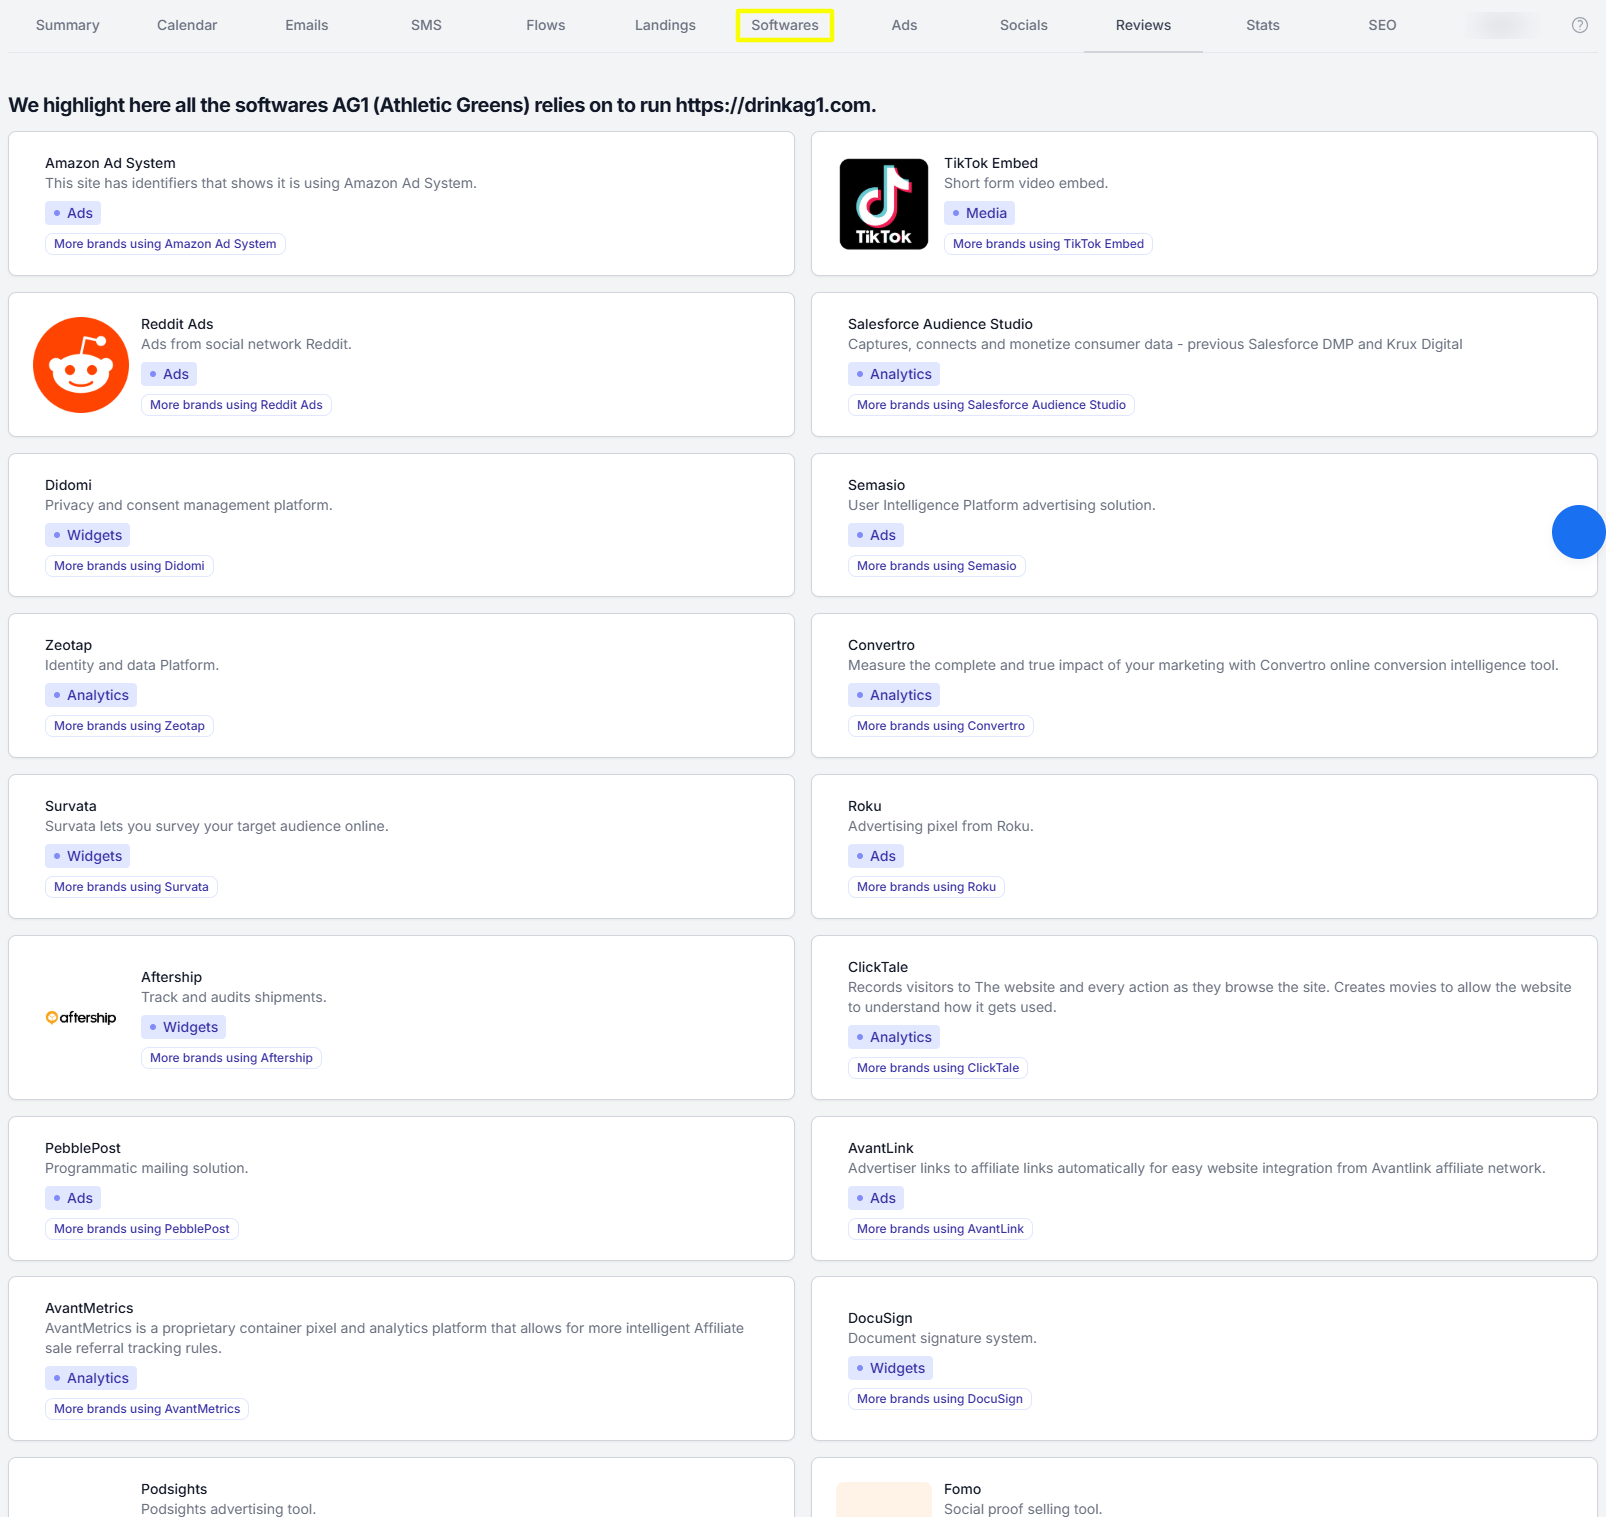
The Softwares tab provides valuable insights into a company's technology stack -- the software tools, integrations, and applications a company uses to run its website and support its digital operations.
This includes technologies related to e-commerce, analytics, marketing automation, customer support, payments, personalization, and other website functionality.
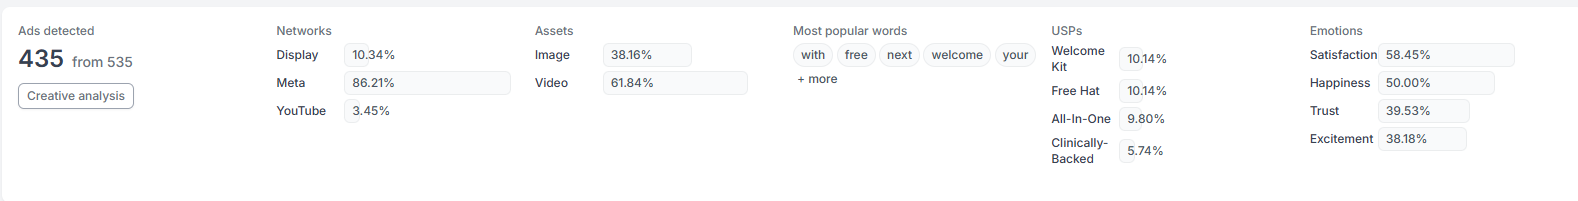
The Ads tab allows you to view, monitor, and analyze a company’s advertising campaigns across different platforms (Meta, Google, YouTube, TikTok, Pinterest, LinkedIn) on different ad types (text, video, image, carousel).
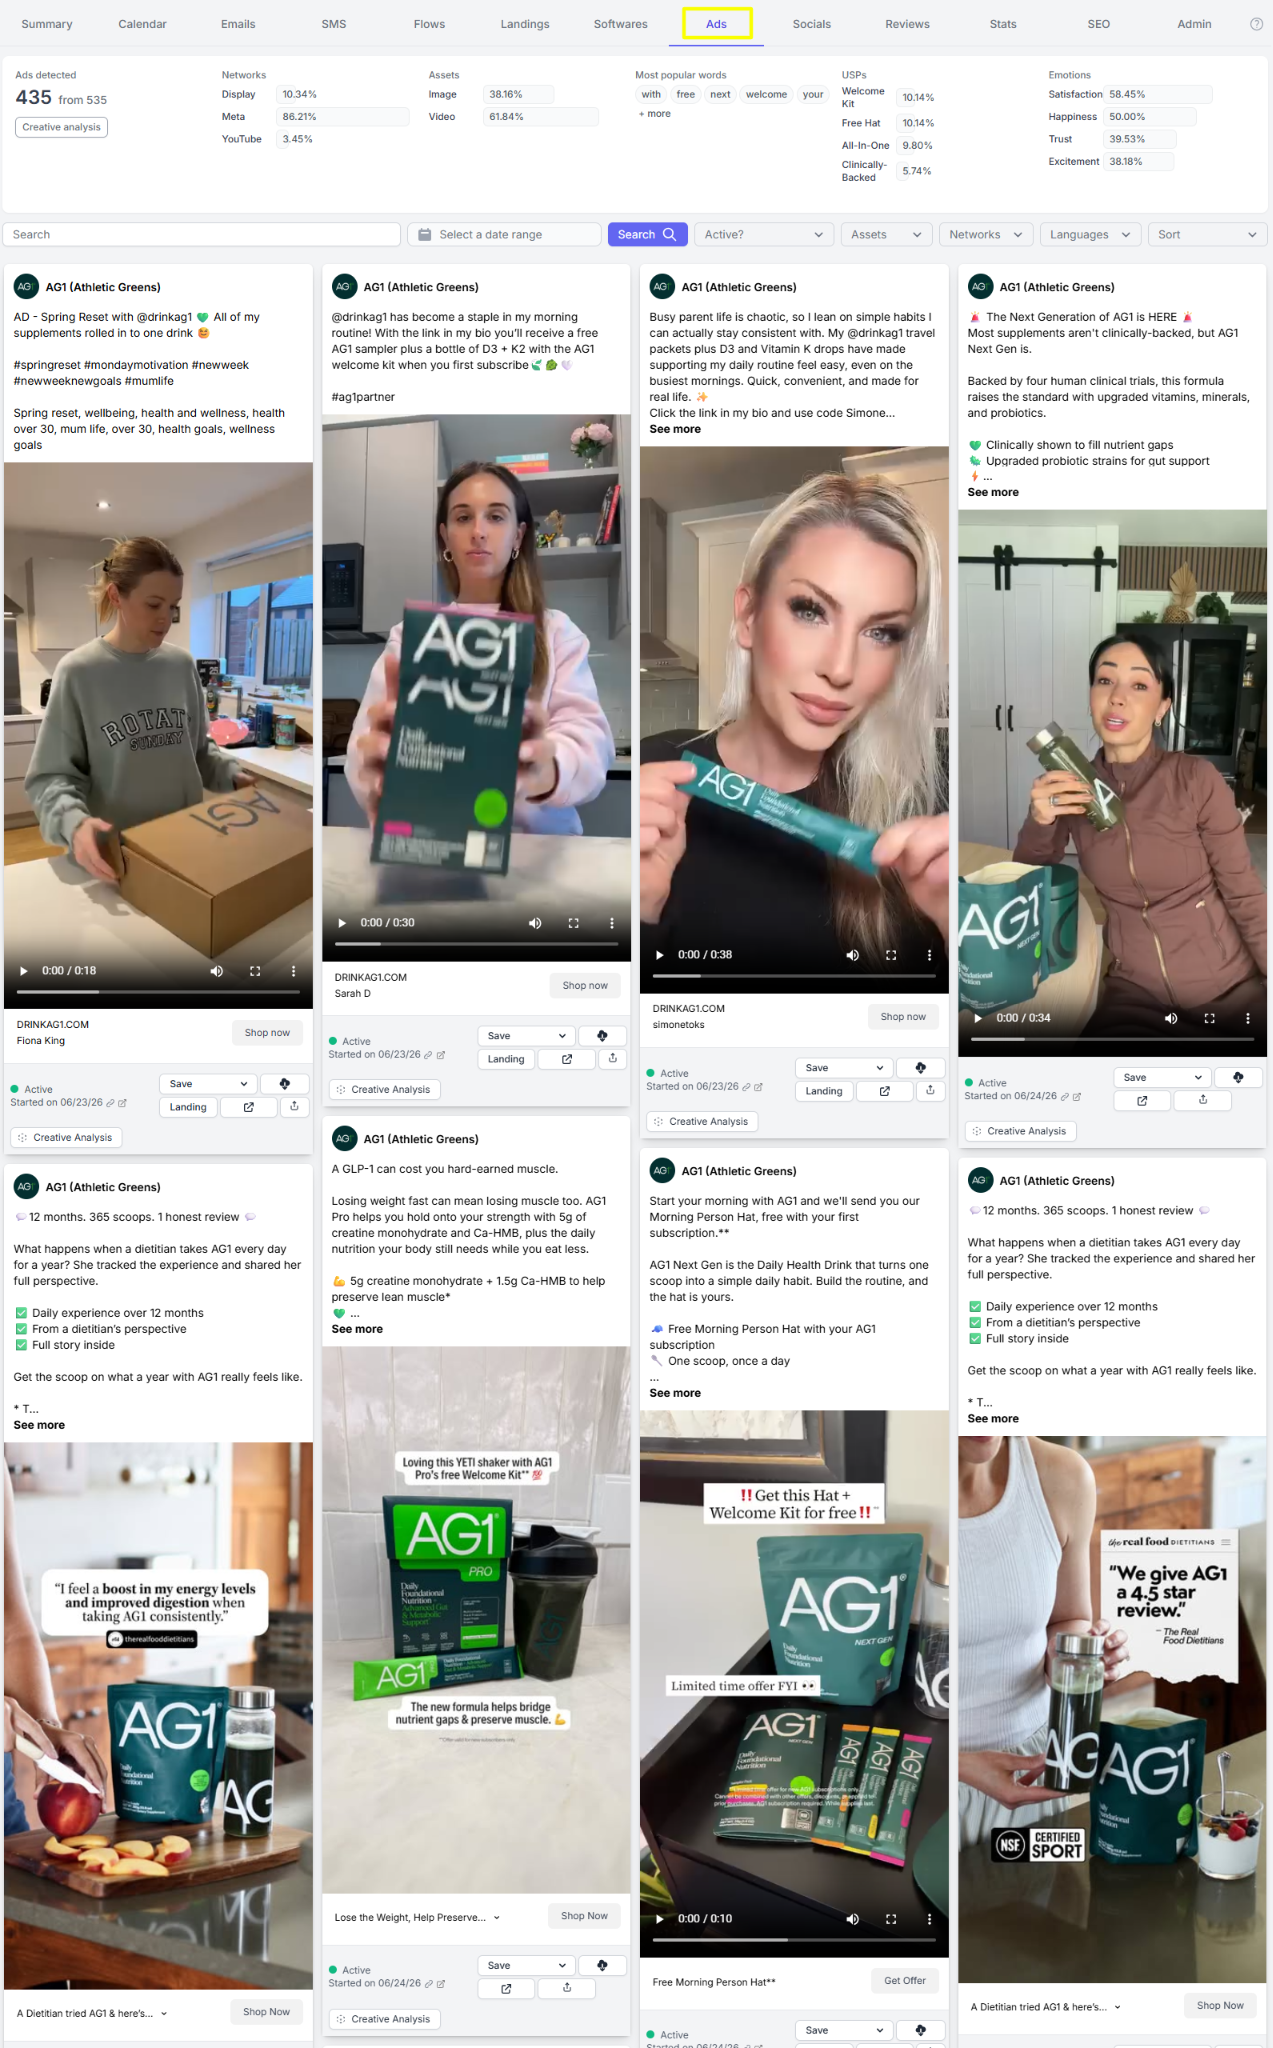
This tab helps you understand how a company promotes its products or services through paid channels. You can examine their campaign frequency, ad creatives, copywriting styles, promotional offers, and positioning strategies.
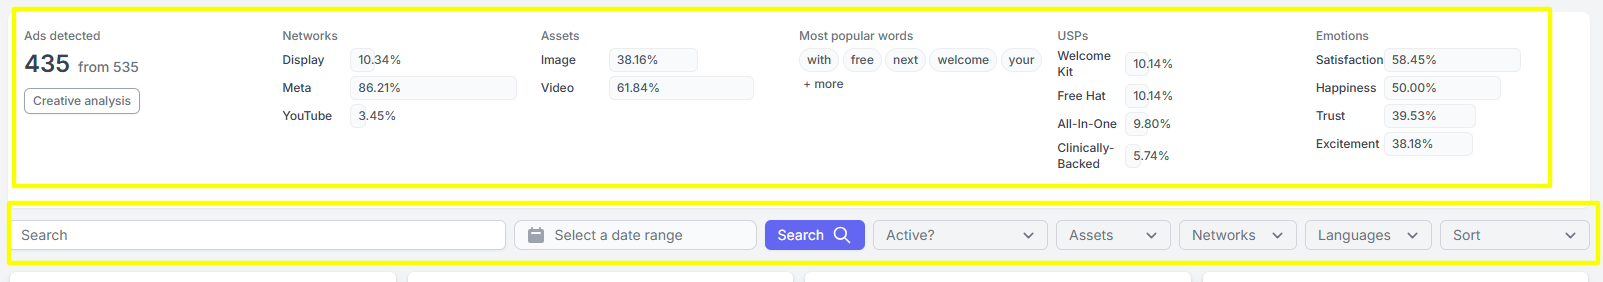
It also includes a search feature that allows you to filter ads by keyword and refine results using criteria such as date range, asset type, network channel, and language. These filters help you quickly narrow down the results to find the exact ads you need to review.
An even more powerful feature is the Creative Analysis extracted from each ad, as shown in the image below.
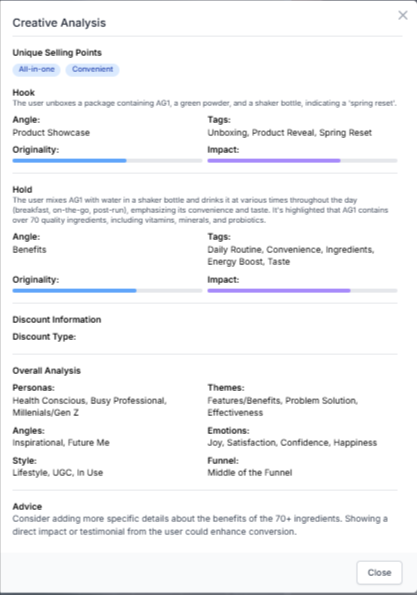
This feature breaks down the key elements of an advertisement to help you quickly understand what makes the ad effective and how it is designed to capture audience attention.
The Socials tab displays a company's published content across its social media handles, such as Instagram.
This tab helps you track posting frequency, content themes, creative styles, and overall social media strategy.
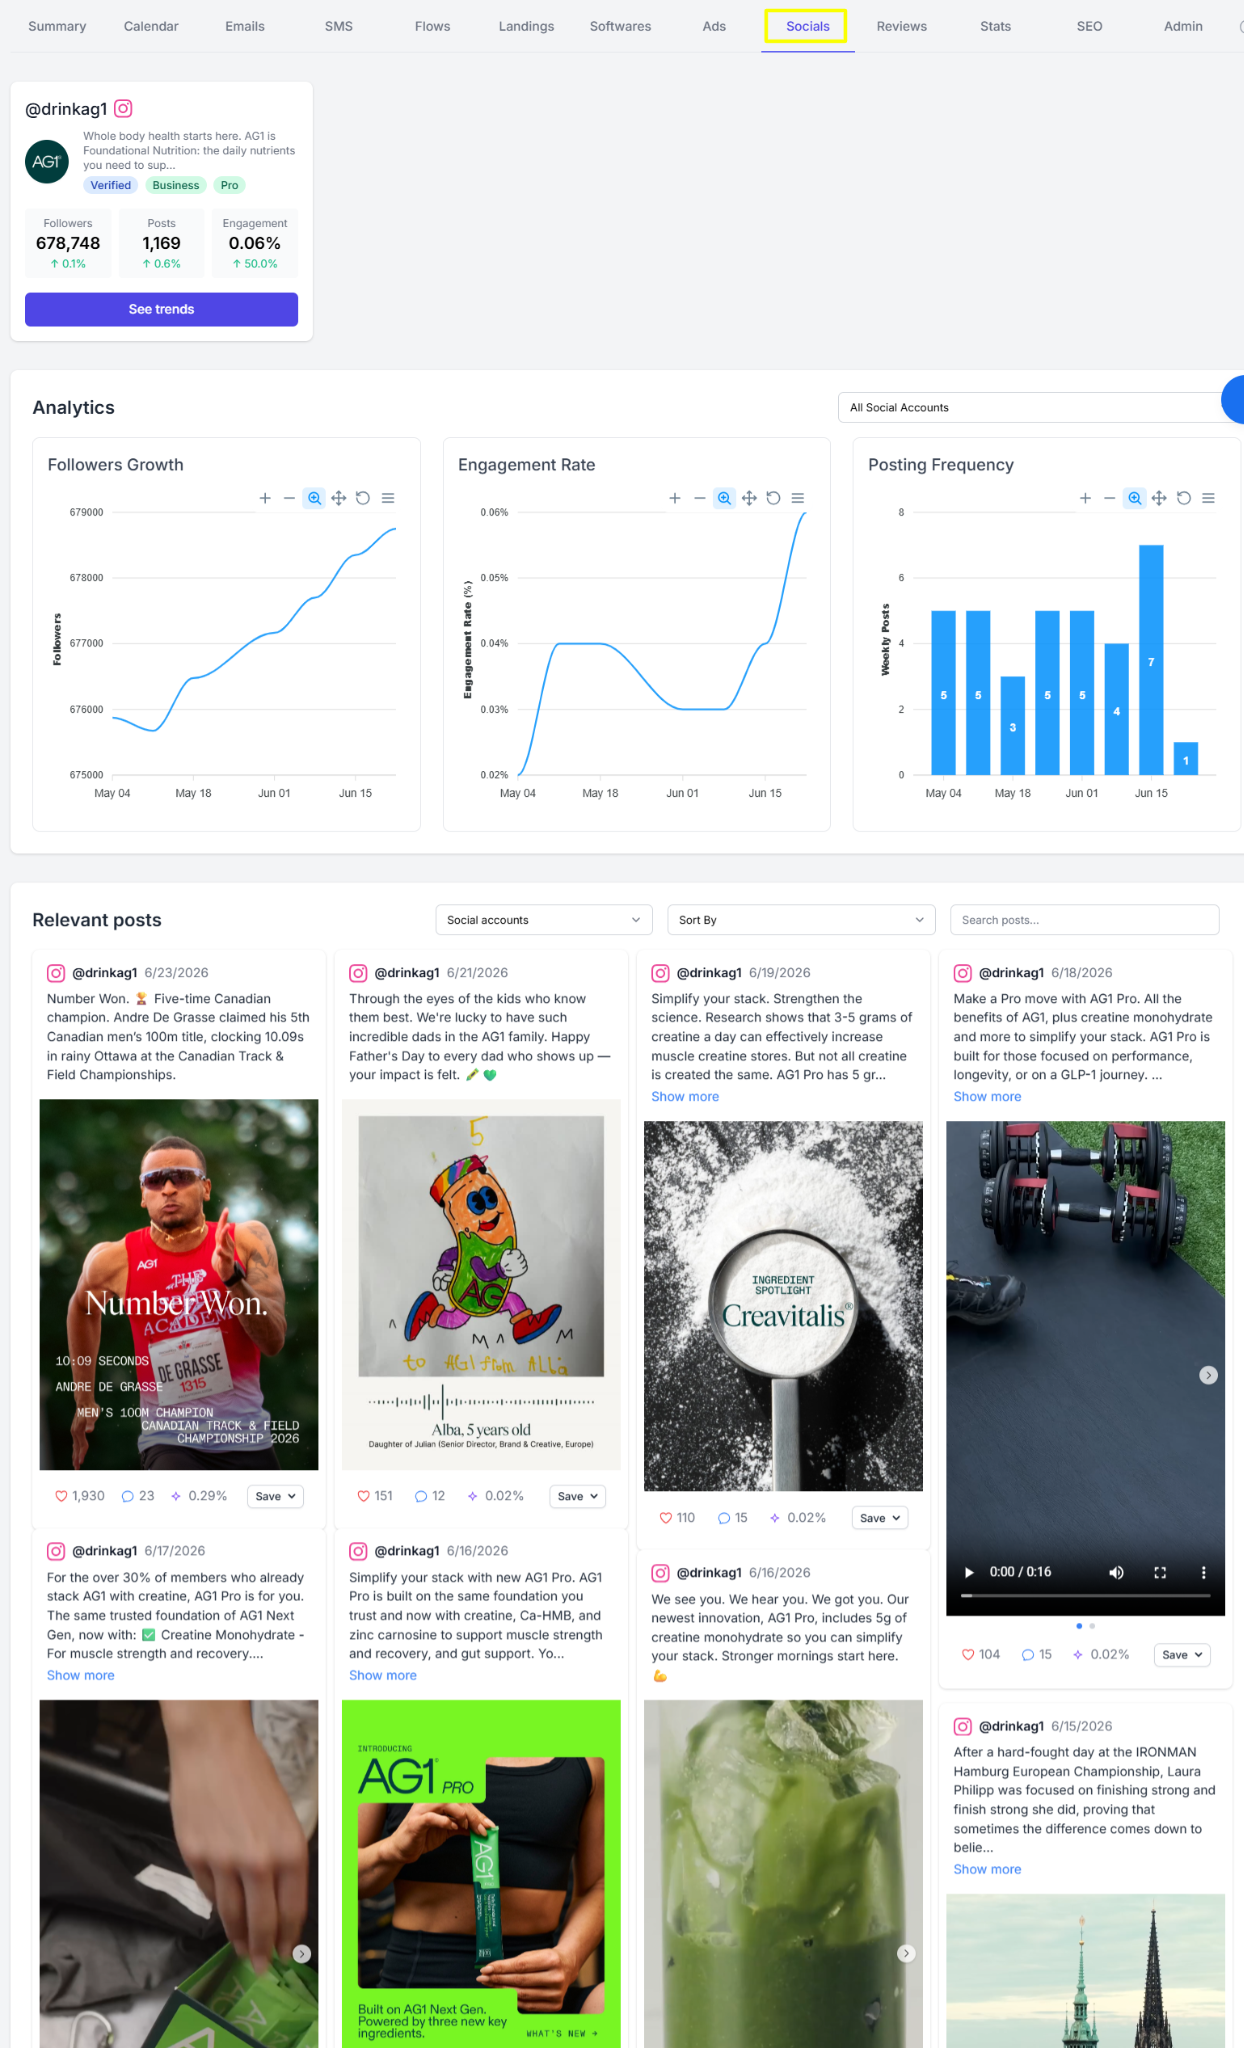
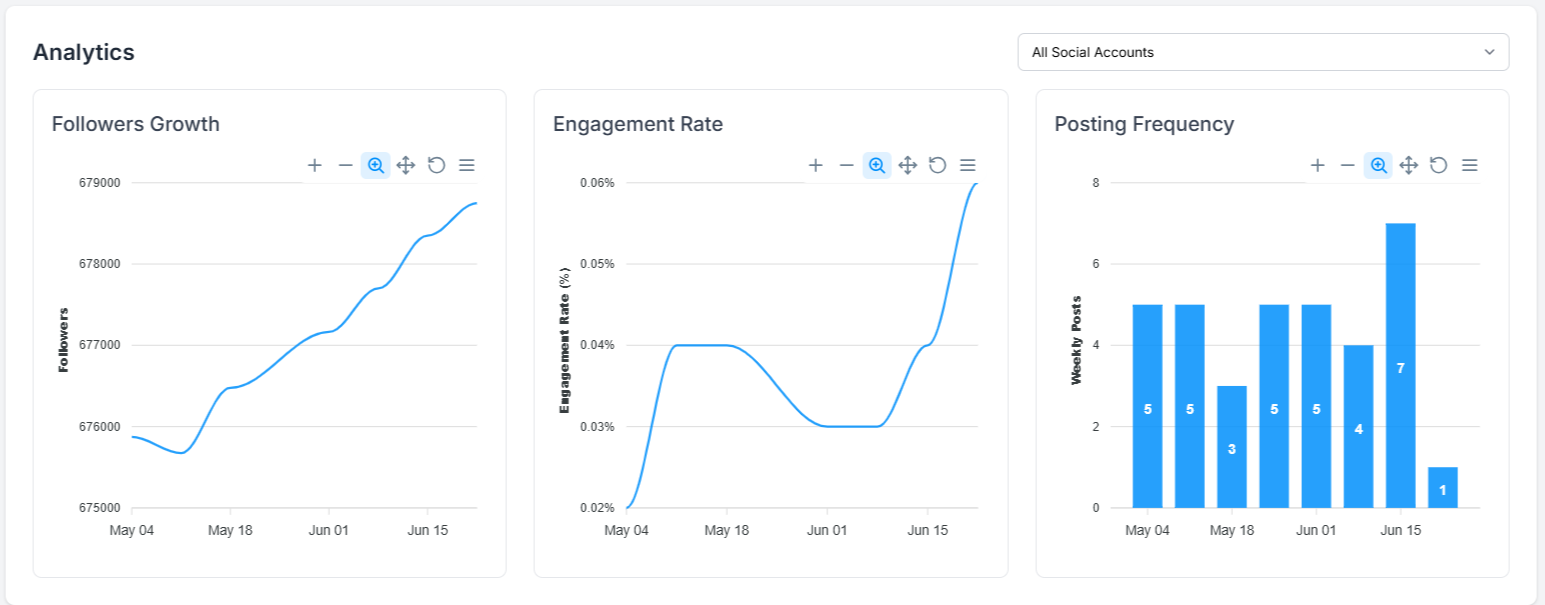
The page also displays an analytics graph to help you track the company's growth in terms of followers, their engagement rate, and posting frequency.
The Reviews tab provides a consolidation of customer feedback and public reviews about a company, collected from various platforms.
It displays the actual customer testimonials and ratings given.
You'll also find a section that provides a snapshot of the overall rating score. Furthermore, it highlights the aspects customers love, and shares areas of improvement accompanied by recommended action for each pain point.
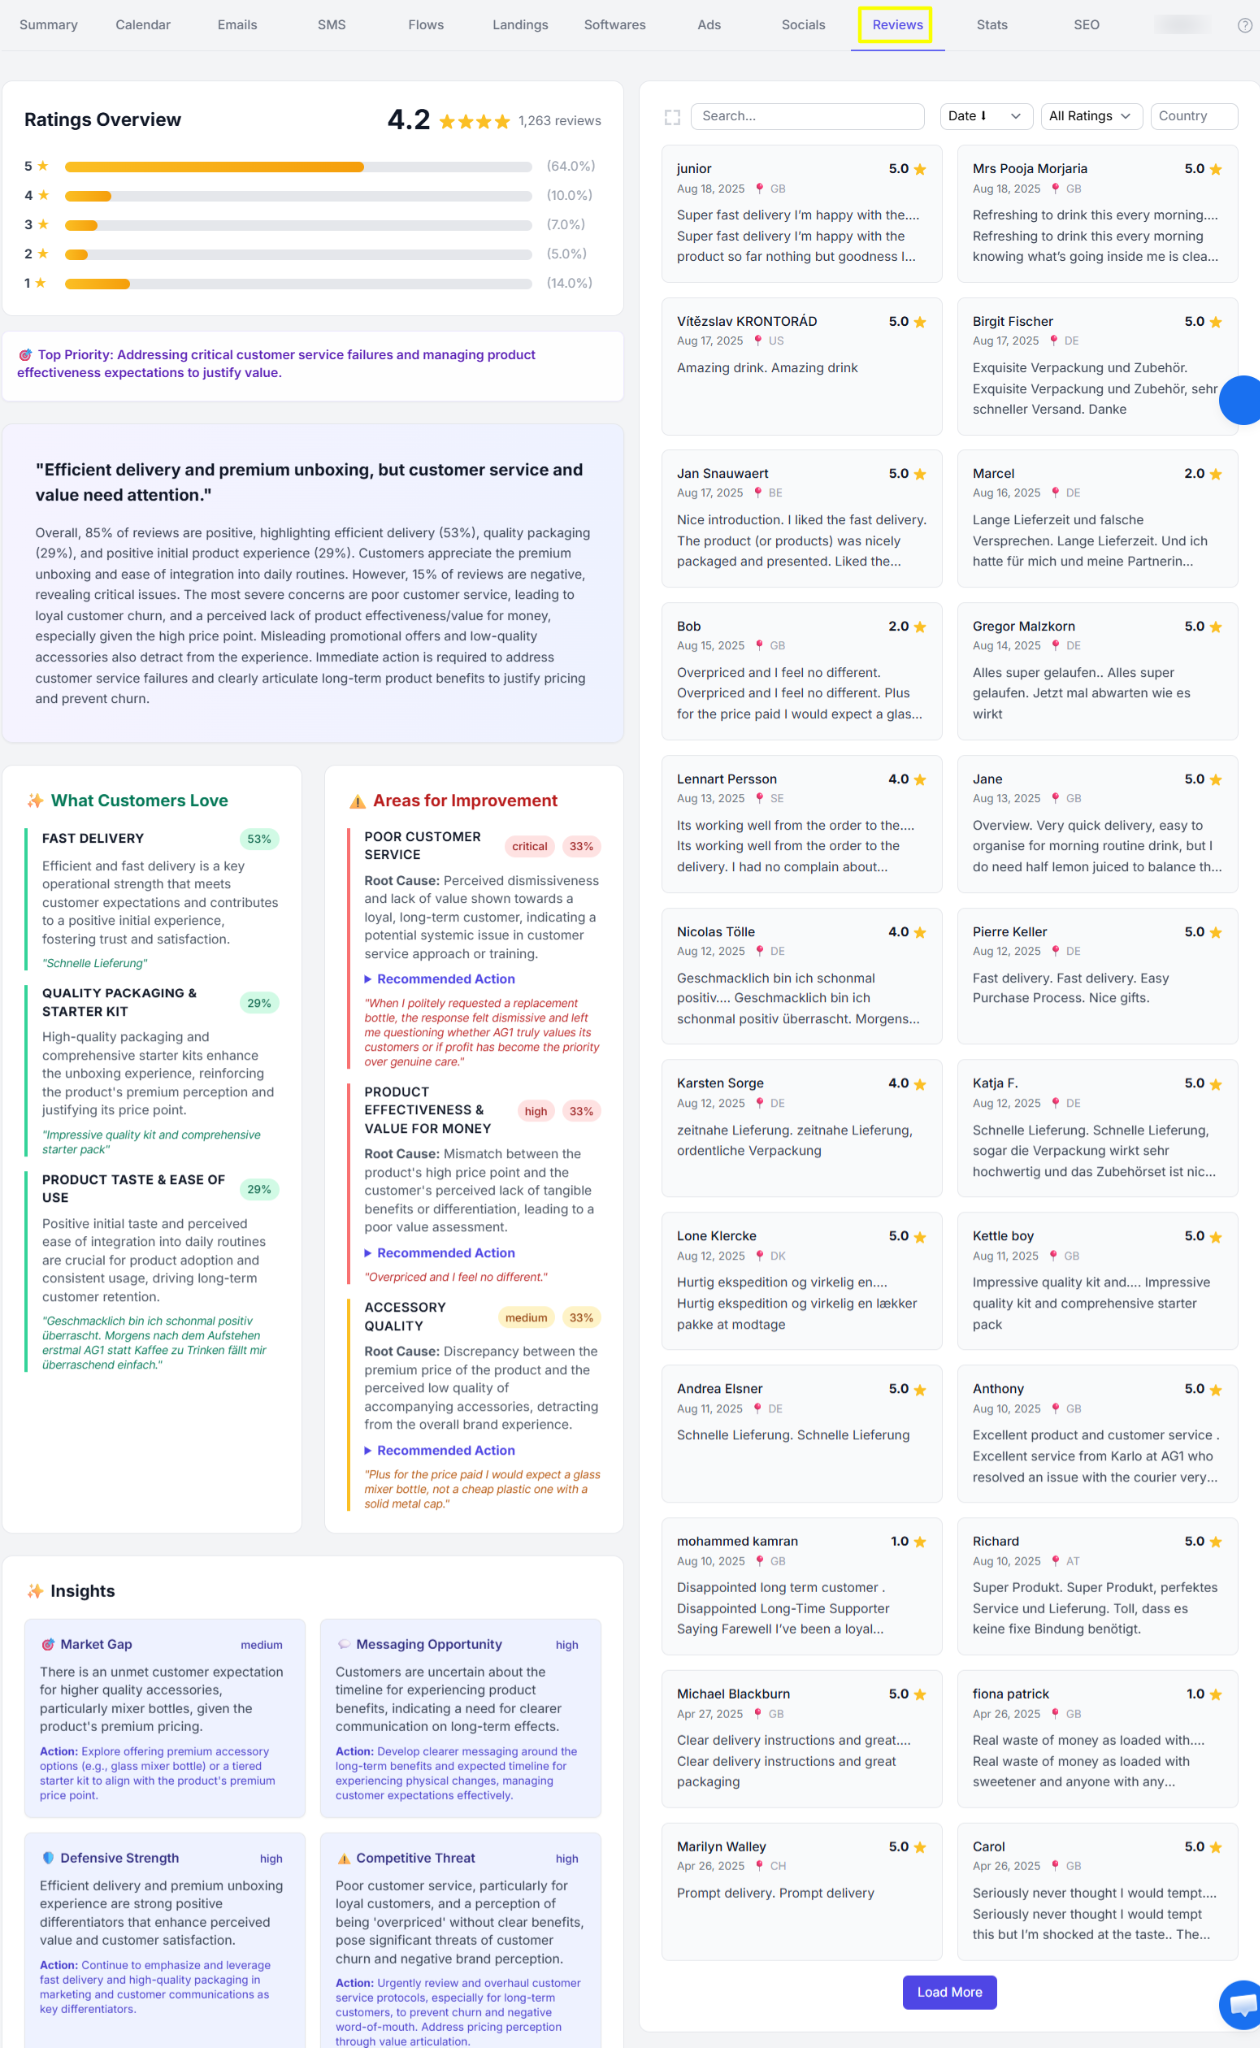
By reviewing customer opinions, you can identify strengths in the company’s offering as well as areas that may need improvement.
The Stats tab lets you access detailed analytics and reports to measure the overall business growth of a company.
It provides a graphical representation of email and advertising trends vs. the industry.
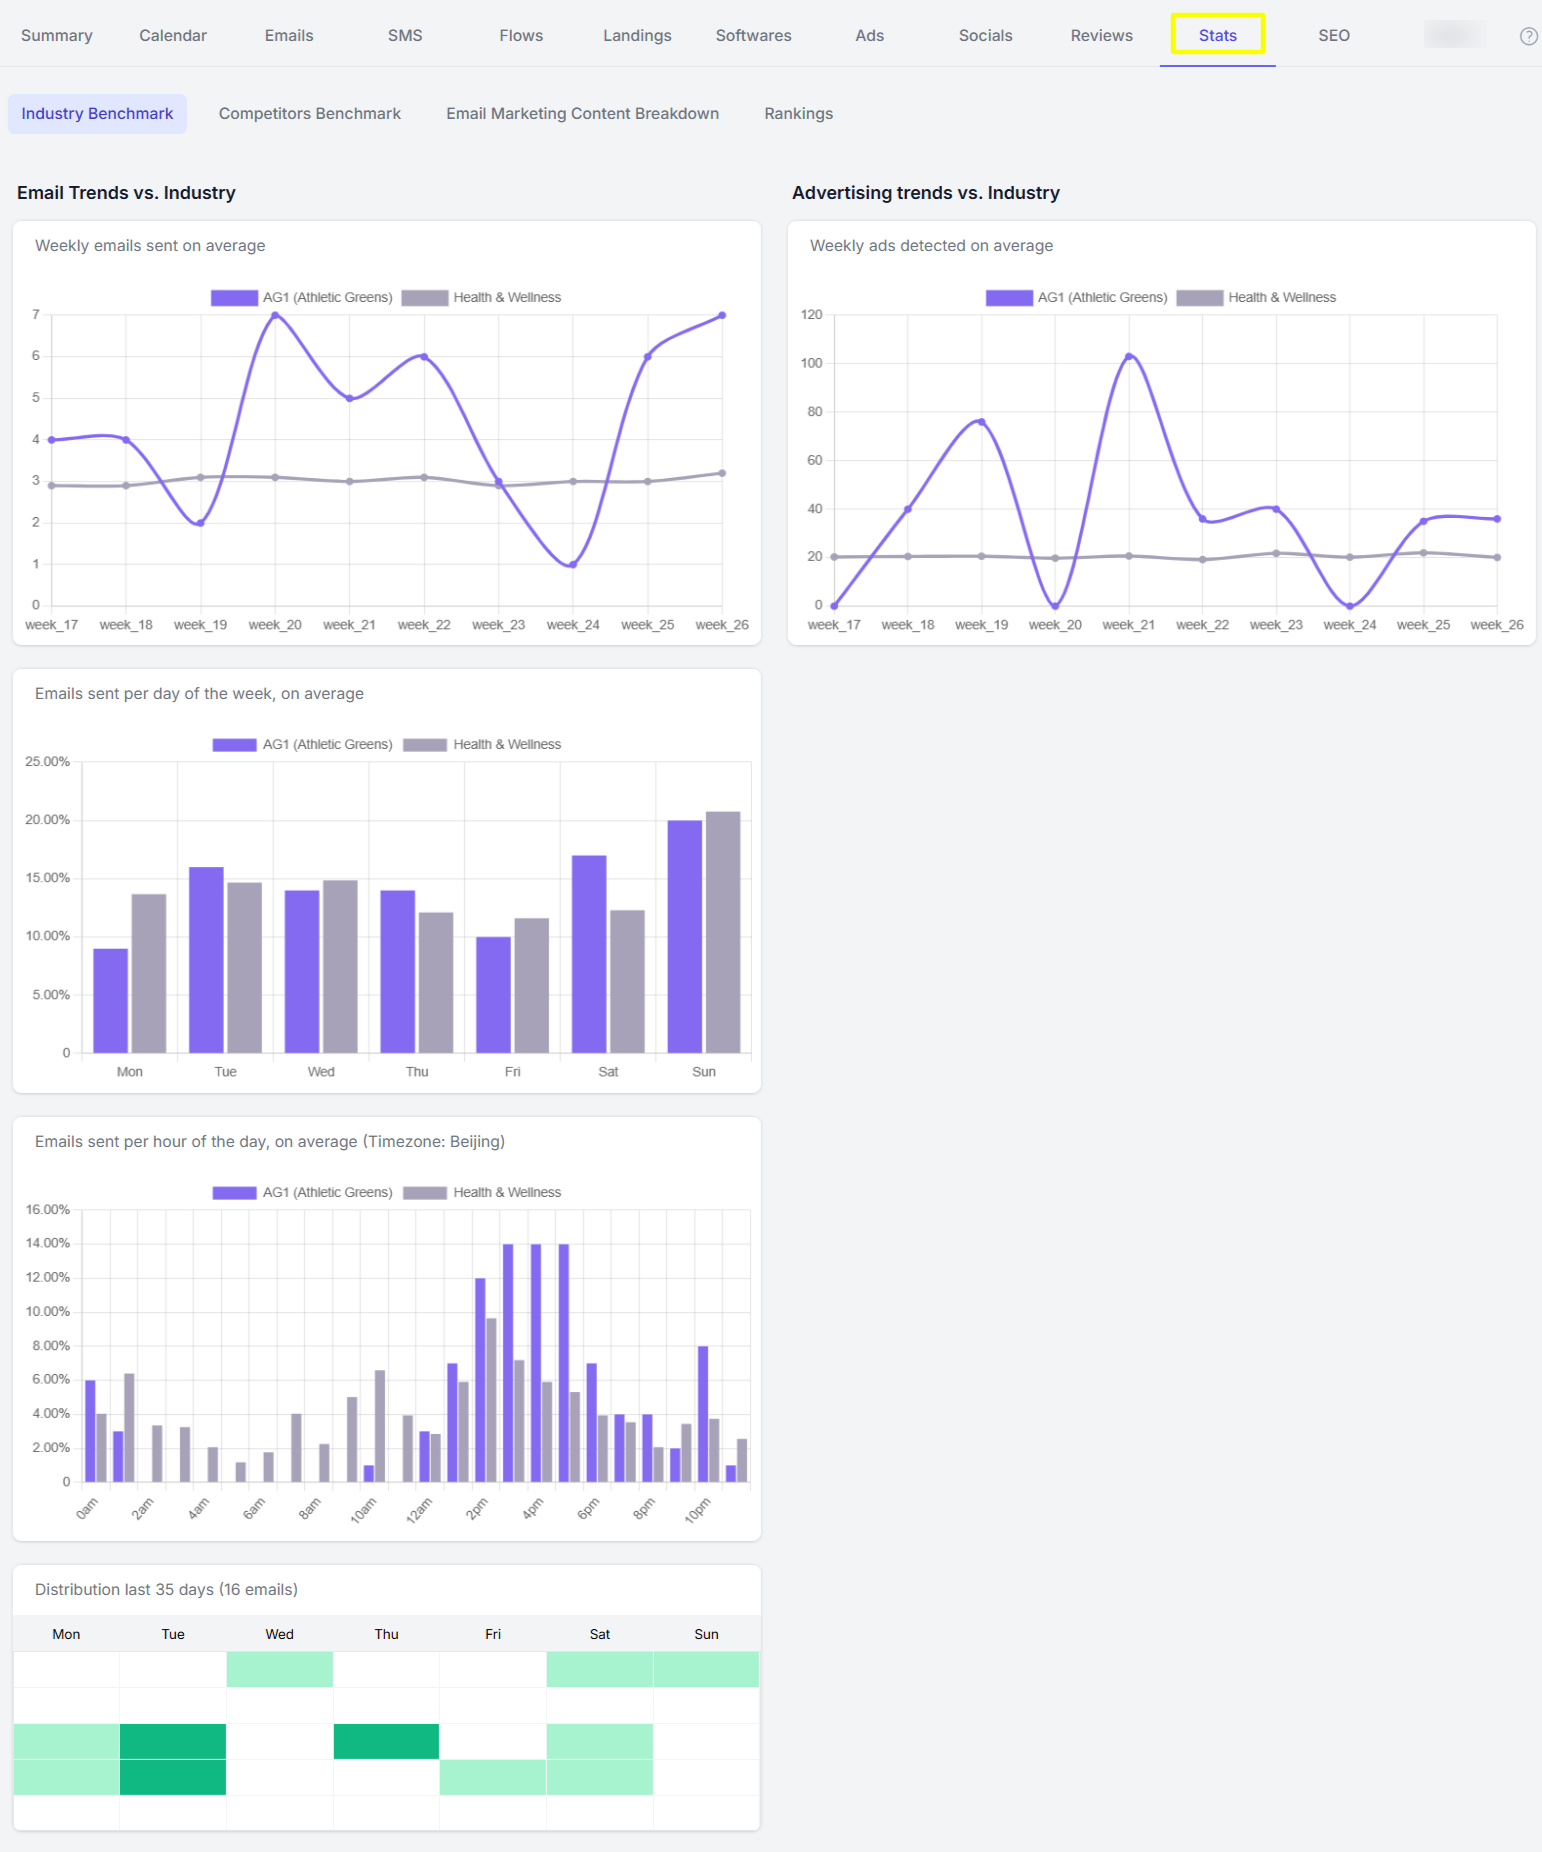
It also shows the email and ad marketing breakdown based on a set benchmark.
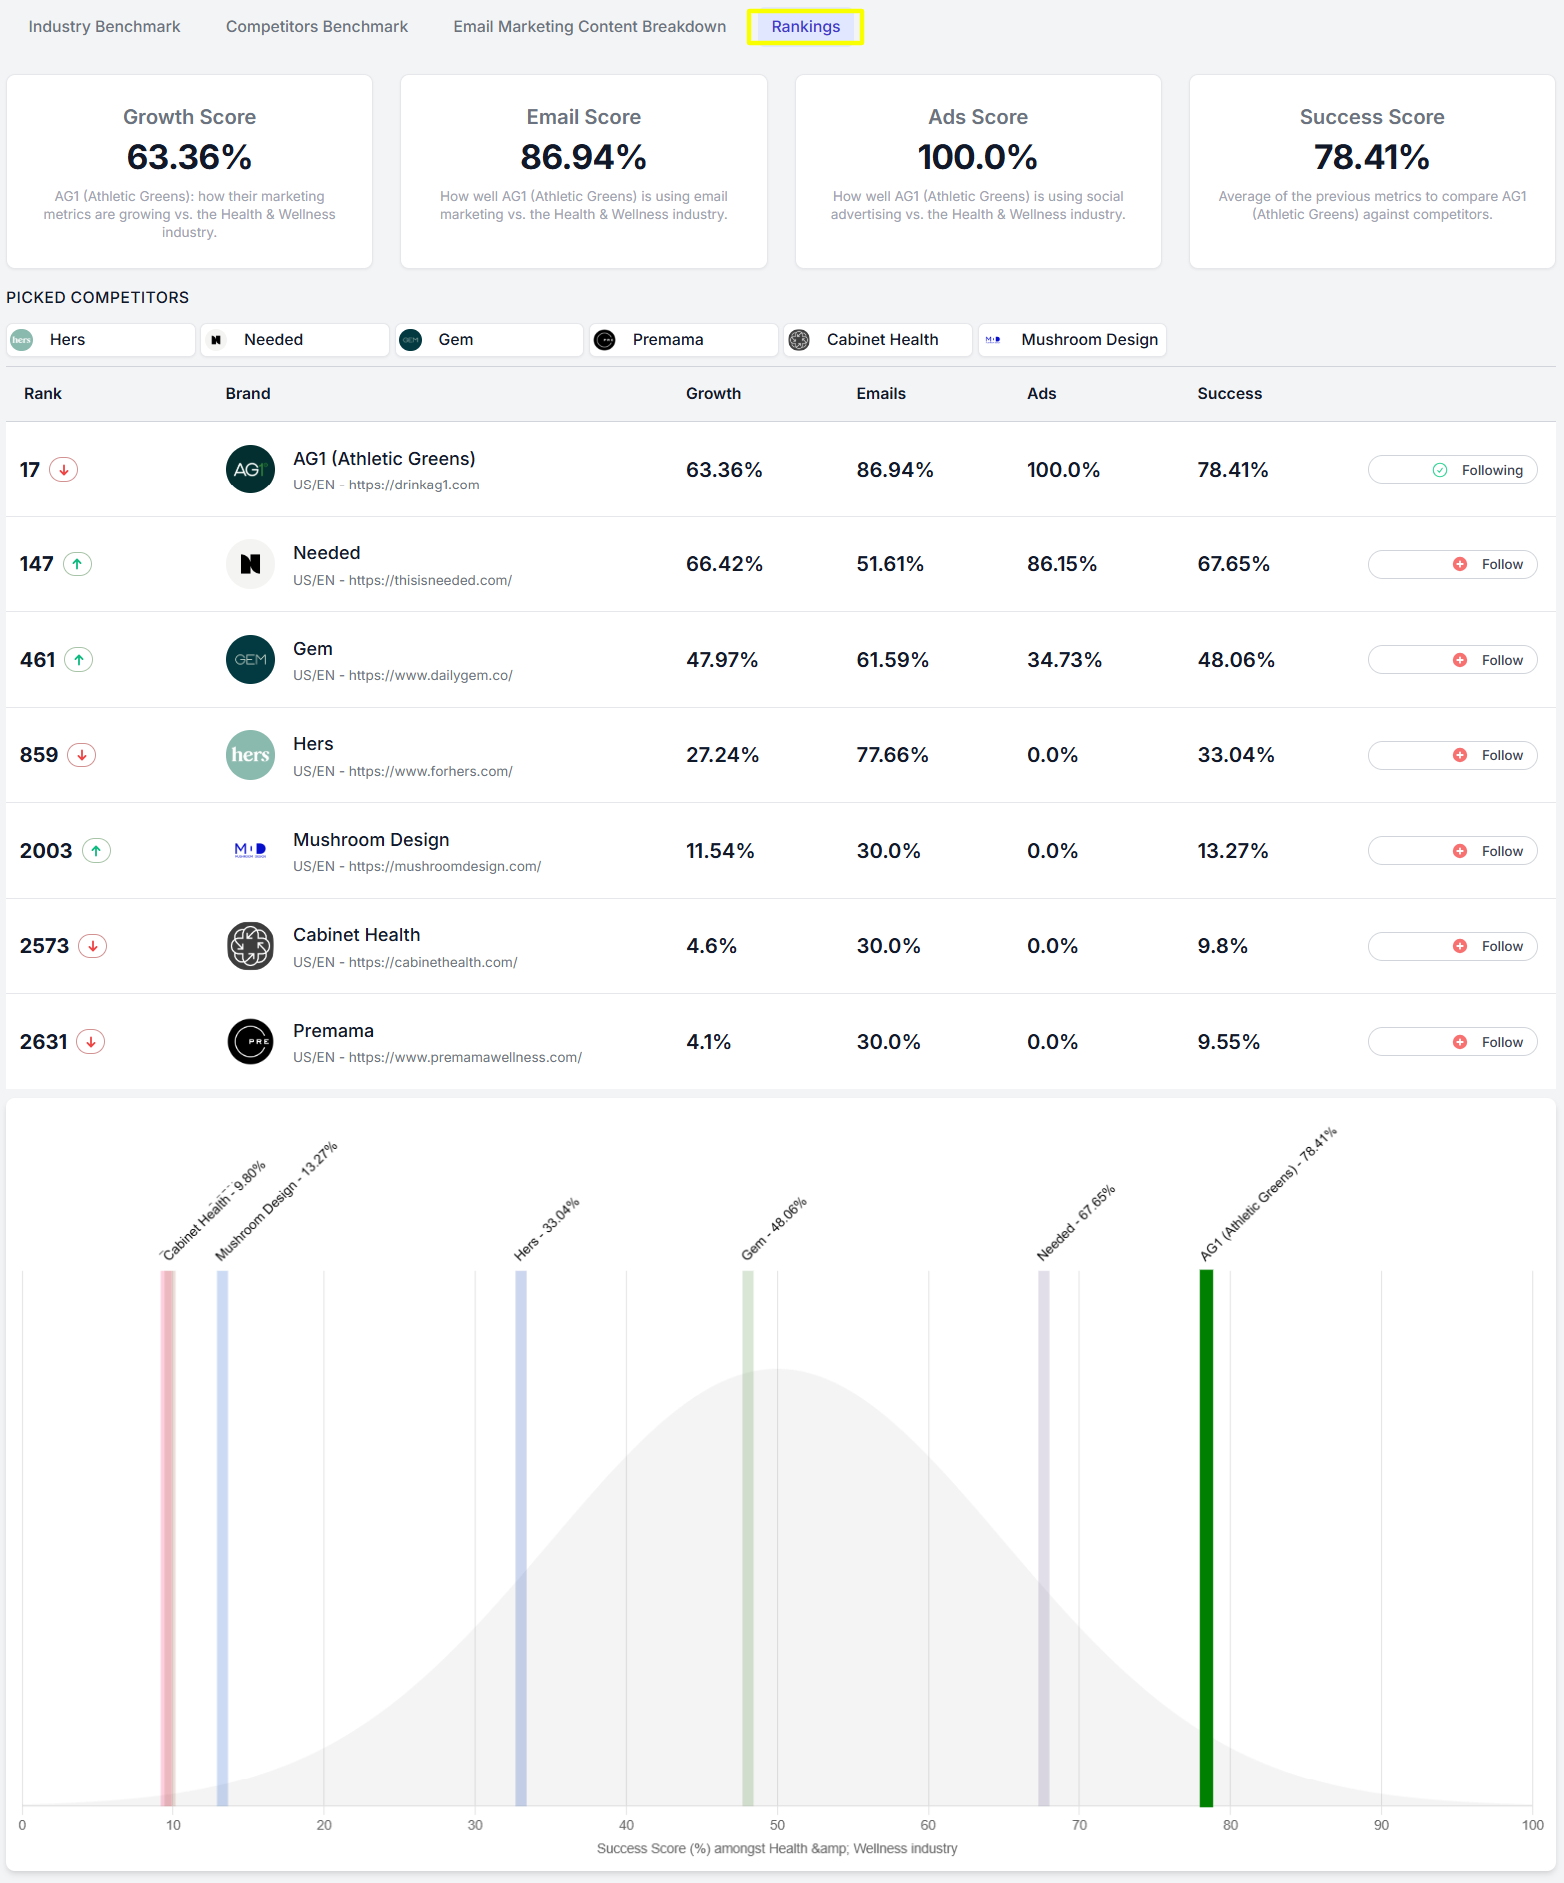
Additionally, it tracks the company's ranking in terms of growth score, email & ad score, and its success score compared to selected competitors.
The Catalog tab provides a comprehensive view of a company's product catalog.
It consolidates product information including price repartition, product tags, and estimated revenue breakdown.
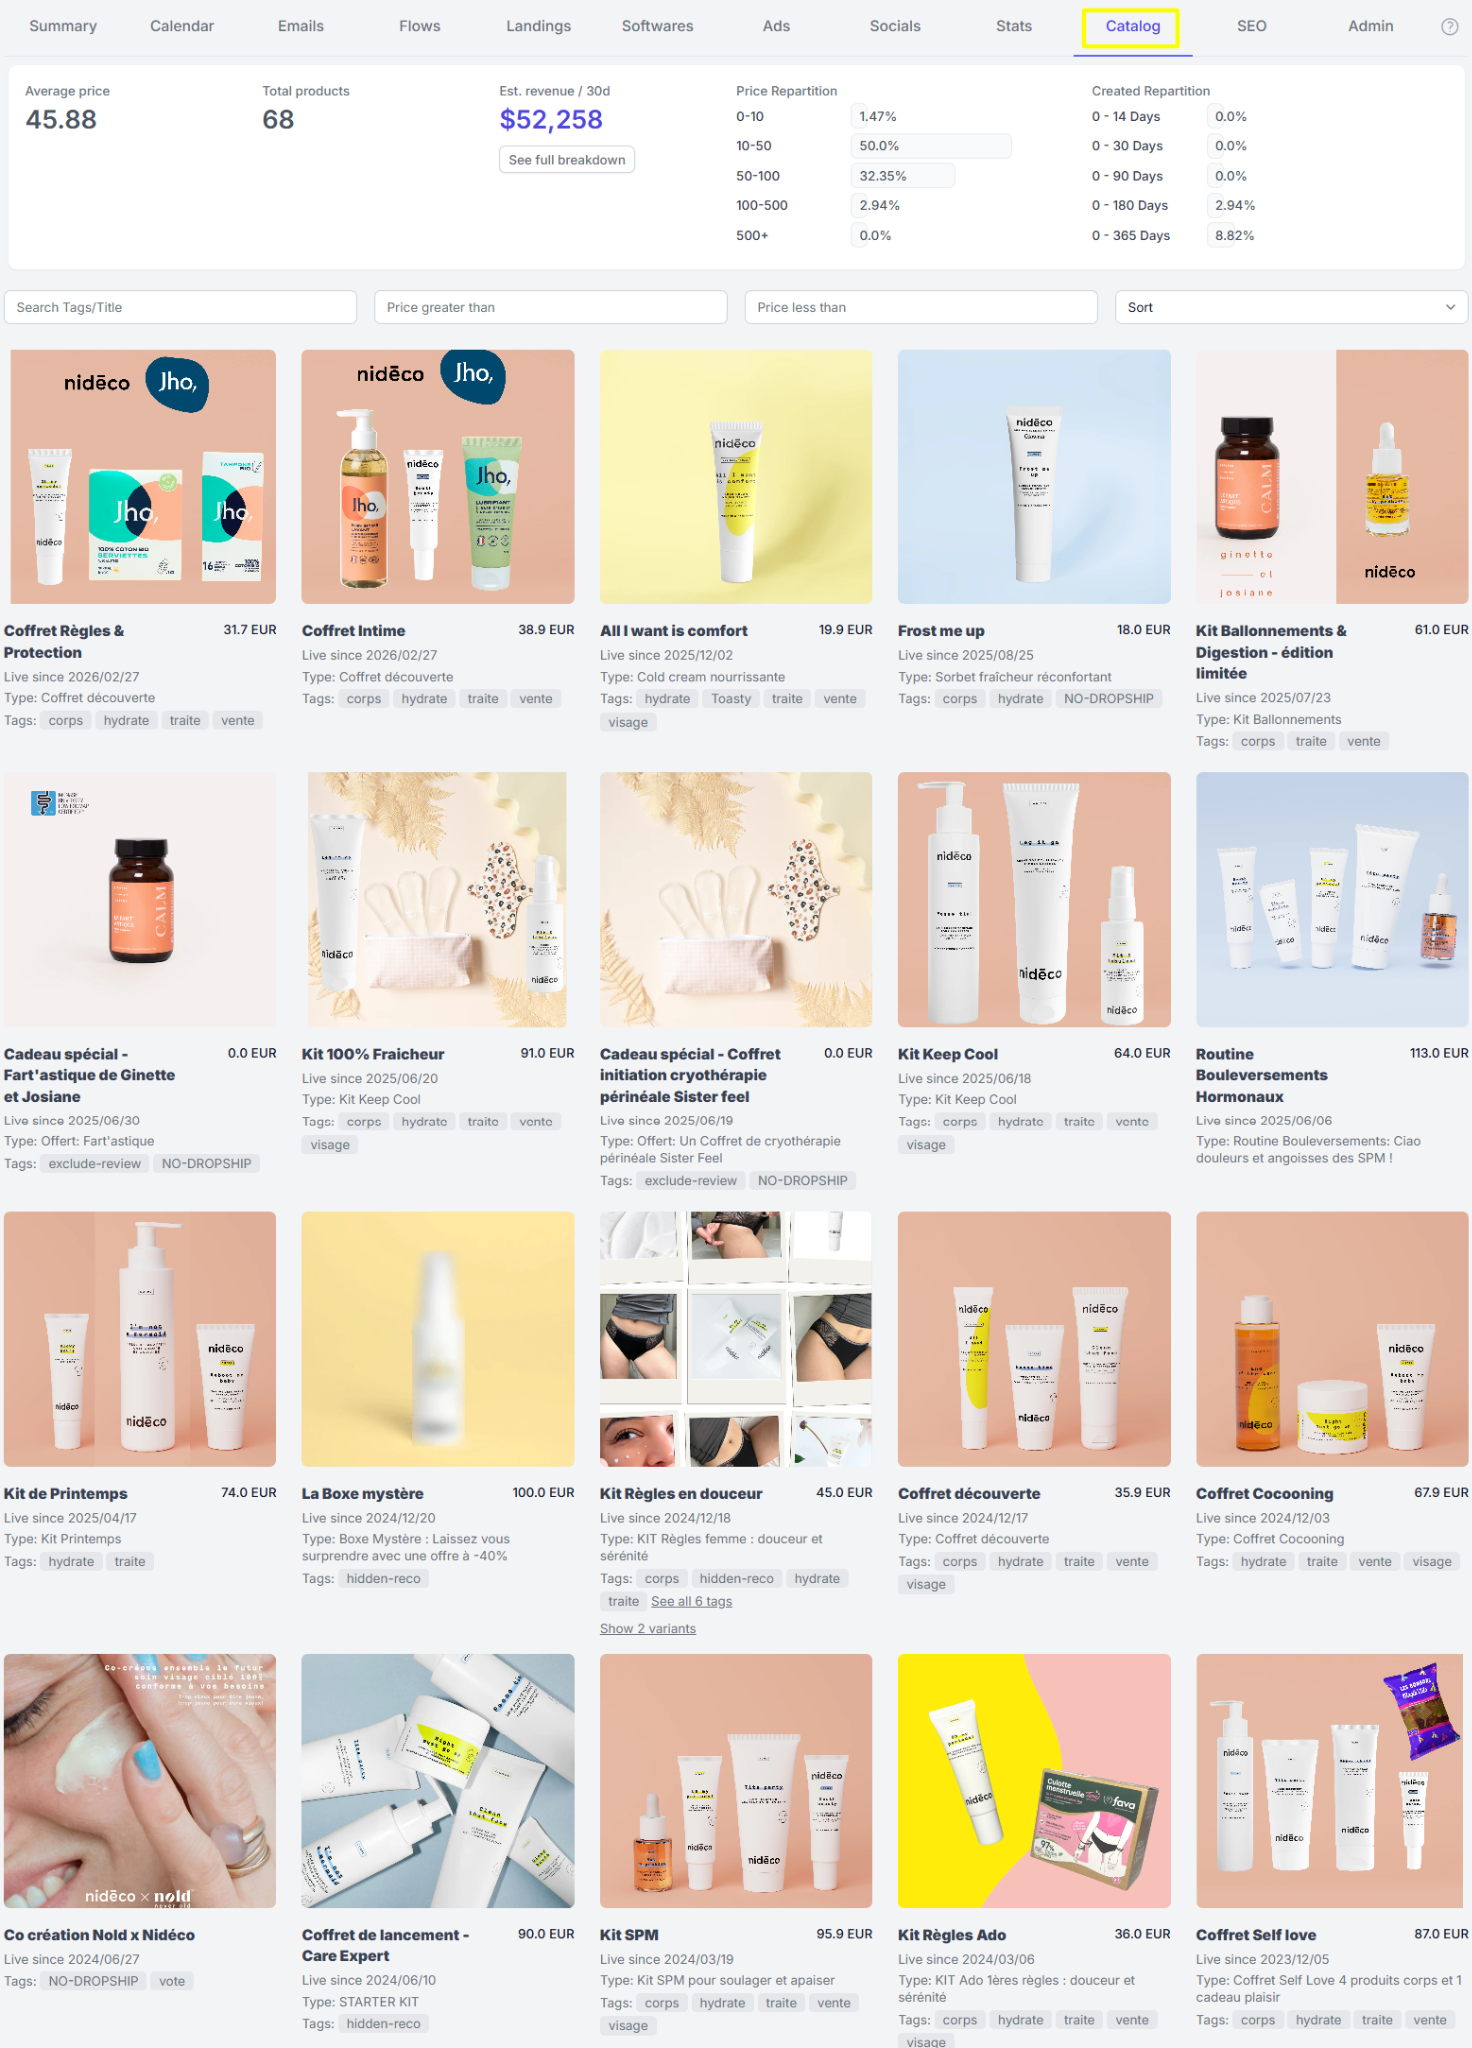
The tab helps you evaluate a company's product assortment and pricing strategy. You can easily identify top-selling or newly introduced products.
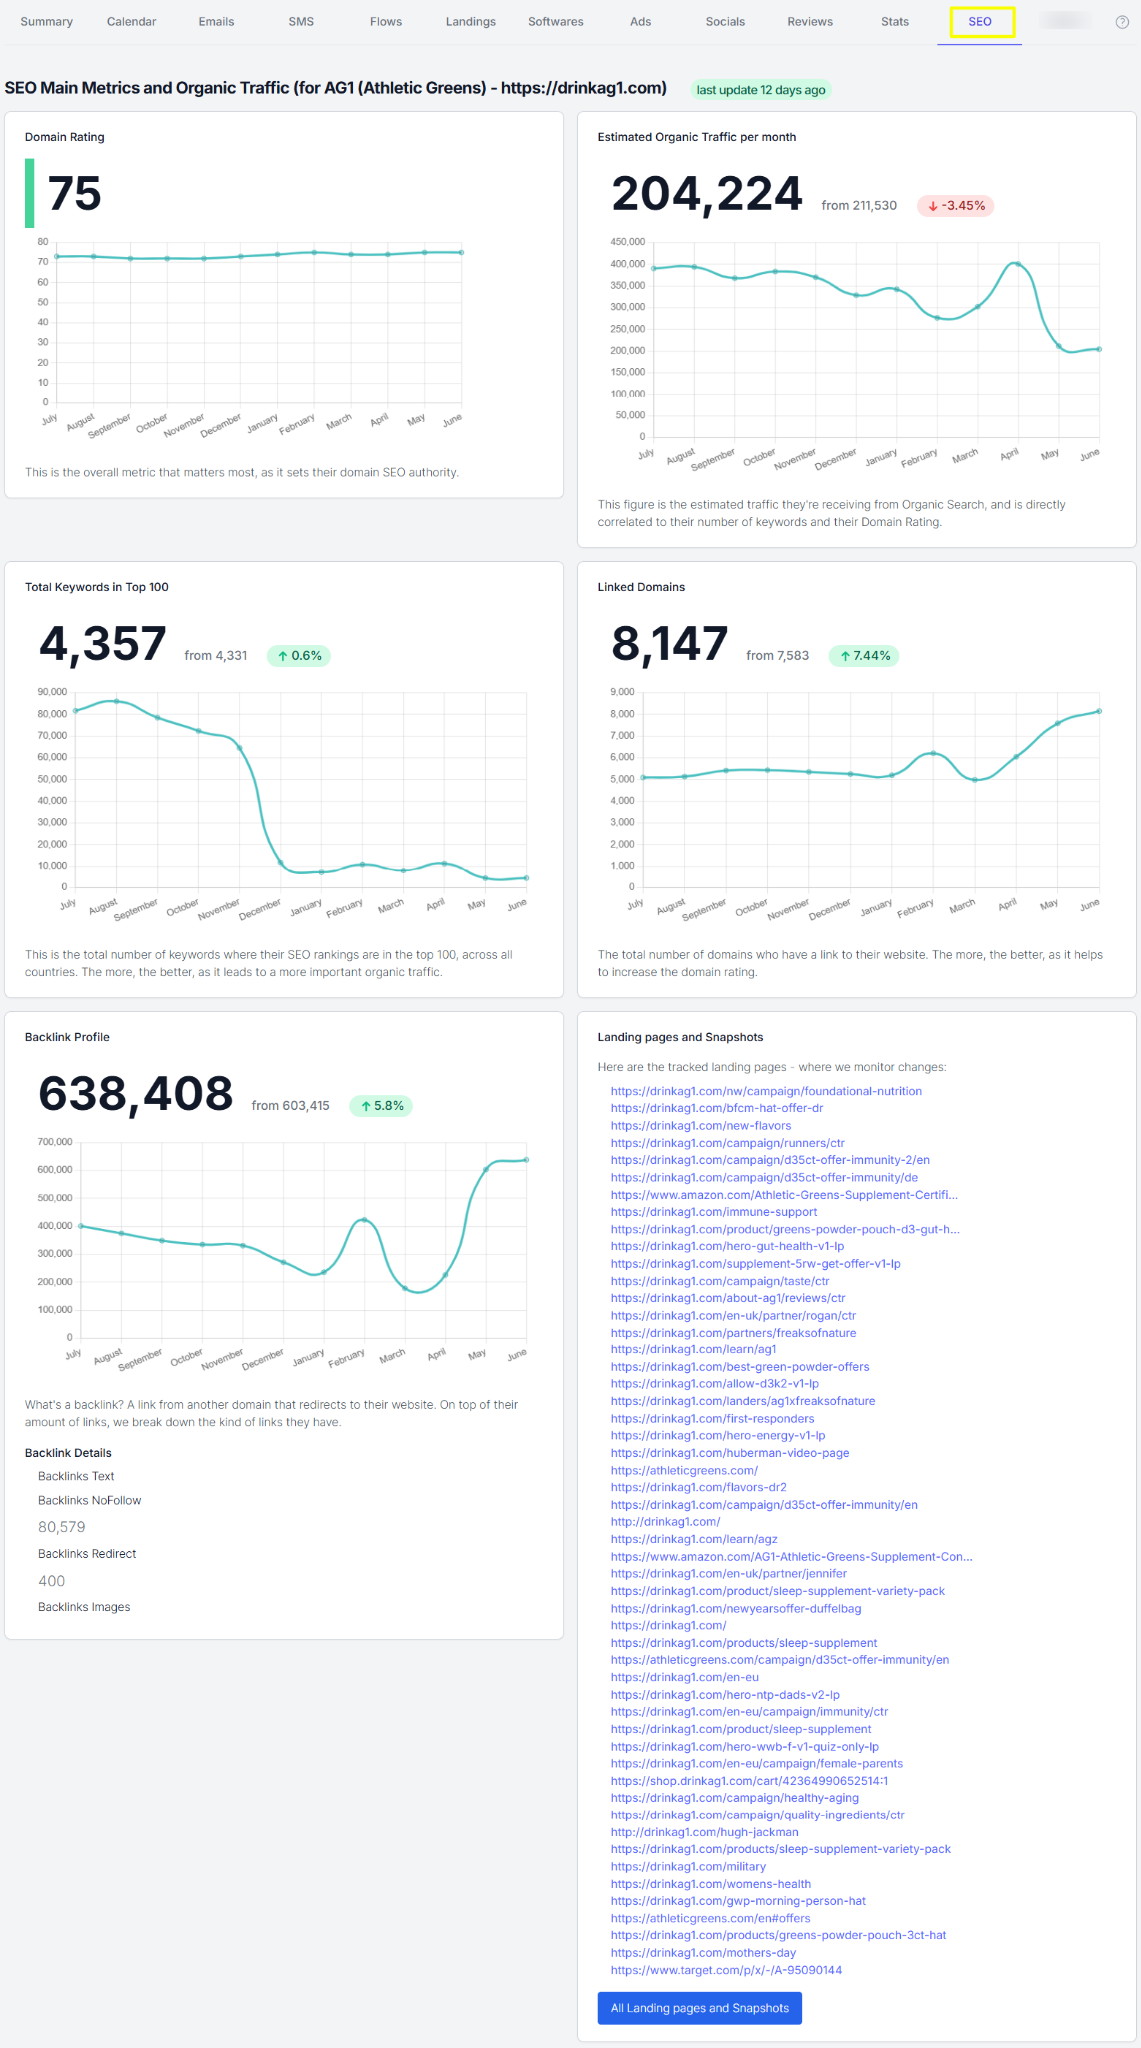
The SEO tab provides insights into how a company performs in search engines and how its website is optimized for organic visibility.


1 minute signup, no credit card required
with our experts


