


Are you struggling to understand where your brand stands in the competitive marketplace?
It’s a common dilemma for many business owners and marketers.
Without a clear picture of how you stack up against your competitors, it’s challenging to identify strengths, address weaknesses, and make informed decisions to drive your business forward.
The uncertainty can be frustrating, leaving you guessing about what strategies are truly effective.
You might find yourself wondering if your marketing efforts are hitting the mark or if your product offerings are meeting customer expectations. This lack of clarity can hinder growth, stifle innovation, and ultimately, impact your bottom line.
But don’t worry—there’s a way out of this fog.
By creating a benchmark and systematically comparing your brand against your competitors, you can gain invaluable insights.
This process will help you pinpoint exactly where you excel and where you need to improve.
In this article, we'll guide you through the steps to set up a robust benchmark, empowering you to make data-driven decisions that enhance your brand’s performance and market position.
But if you want to speed things up a little, you can always use Panoramata, a benchmarking and competitor tracking platform where you can track and compare yourself against any brand you choose. Generate benchmarks automatically on Panoramata so you remove all the steps below and get straight to your analysis.
Create your first benchmark on Panoramata for free by clicking below.
What is a benchmark in marketing?
A marketing benchmark is a measure of a brand, company, or product’s performance compared to its competitors or industry standards.
Benefits of Benchmarking Your Competitors
Our goal here is to make sure you can benchmark your competitors’ digital marketing strategy easily and compare automatically what they’re doing, how many emails they’re sending, how many ads they’re publishing, etc.
You can also compare yourself amongst them so you can see where you stand.
Benchmarking your brand against competitors is a powerful strategy to gain clarity and drive growth. By regularly comparing your performance using well-defined KPIs and industry benchmarks, you can uncover critical insights that inform your decision-making and keep you ahead of the curve.
It allows you to do several things:
- Check what your competitors are doing
- If they’re changing their strategy over time
- Where do you rank amongst them
- What are some of their best practices that they’re sticking to over time (hint: these are the ones you might want to have a look at!)
If you find this process too time-consuming, we’ve created a tool dedicated to benchmark creation on Panoramata.
How to Make A Benchmark
This is an example of a process to use if you want to compare your brand’s performance to other brands using a benchmark.
Step 1: Determine your KPIs and know your current performance—the baseline for your benchmark
Understand where you’re at before you start gathering information about your competitors. Set key performance indicators that will form the basis of your benchmarking — you should pick metrics you could get from your competitors!KPI examples include
- emails sent
- ads published
- spam score and deliverabity
- ad networks they’re using
- sms sent
- promotional rates
- social media followers
- social media likes
- SEO rankings for main keywords
- domain authority
Start with a few metrics to avoid overwhelm. Then, collect data using tools like Panoramata or Social Blade.
Step 2: Identify your competitors
Next, determine which competitors you want to include in our benchmark. You can also compare your brand with industry leaders in your market.
Step 3: Gather performance data about your competitors
Using third-party tools like Panoramata, monitor your competitors performance. Narrow the parameters by setting a period you want to analyze such as the previous quarter or previous six months.Collect the numbers and put them on a spreadsheet or document.
Step 4: Summarize your findings in a report
Then, create a report presenting the data you’ve gathered in an organized way. This report relays your findings to your team or stakeholders in a visual and easy-to-understand format.You can present the insights in a white paper, infographics, video, or slide presentation.
Step 5: Plan your next steps based on the benchmark
Update your marketing strategy based on the insights in your benchmark report. Ask yourself what goals you want to achieve in the next months, quarter, year, or years.Rinse and repeat the above steps at a frequency that suits your brand.
How to benchmark your ads against other ads
After picking an ad competitive analysis tool, analyze the following:
- organic keywords
- paid keywords
- backlink profile
- search ranking
- Ad networks used
- Ad format (text, video, image) and channel (Google Search, Display, Shopping)
- Ad copy and creative
- USP
- discounts
- tone
- freebies and perks
- brand personality
- use of urgency
- landing pages used
- Product centric
- Direct response
- Advertorials, etc.
How to Benchmark on Panoramata
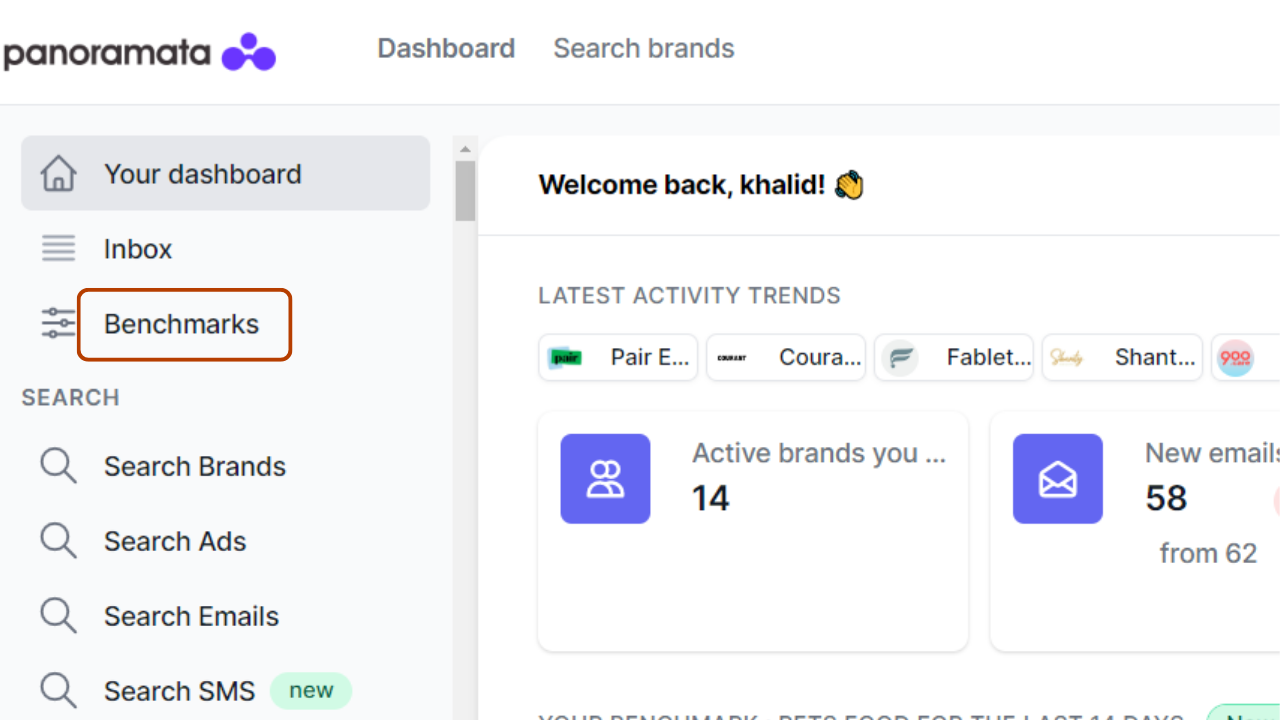
Step 1: Go to Benchmarks at the top left of your Panoramata dashboard.
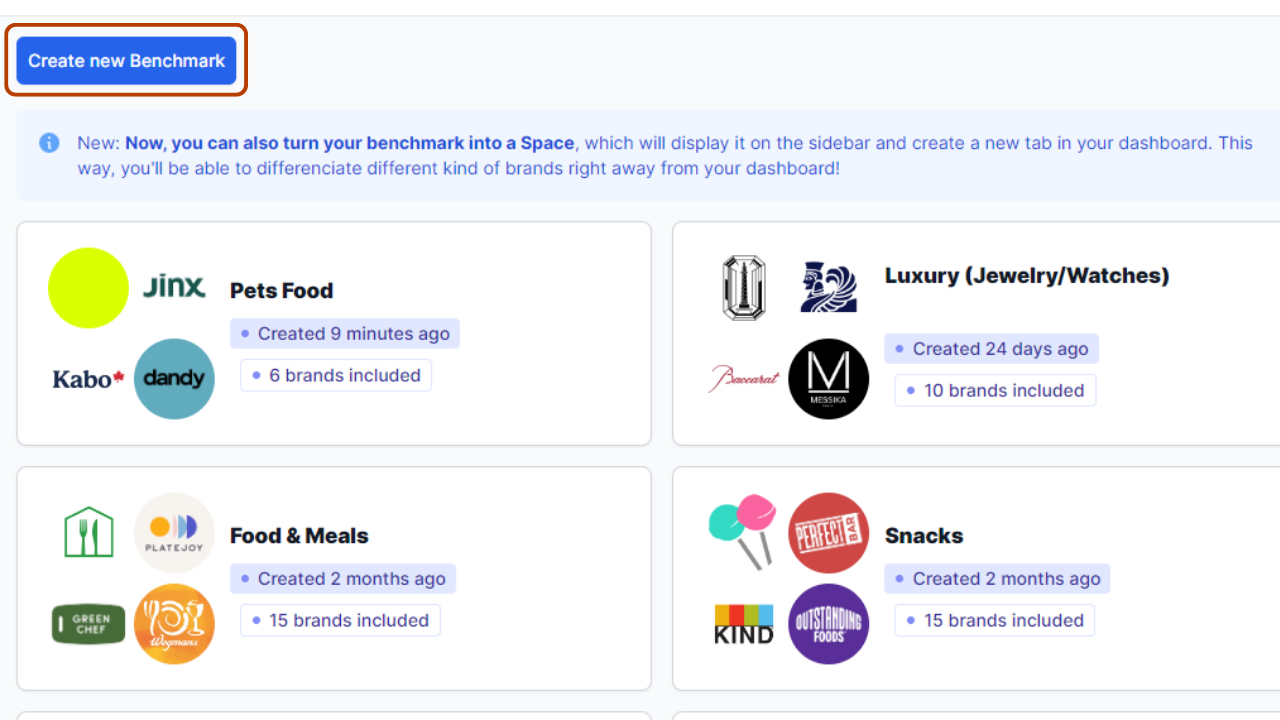
Step 2: Create a new benchmark by clicking on “Create new Benchmark”.
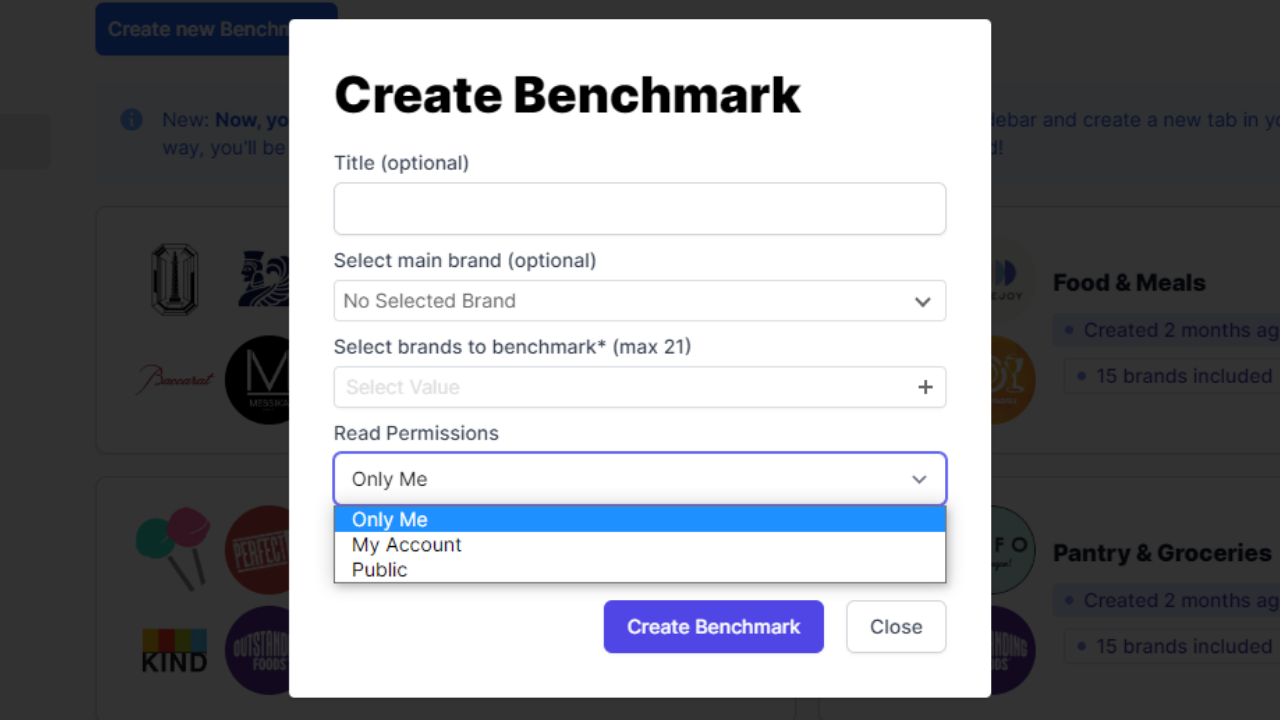
Step 3: Give a title to the benchmark.
However, this step is optional so you may leave it blank.
Step 4: Select a main brand (this is also optional).
If you want to compare a specific brand to the other brands in the benchmark, you can search for it via this field. Otherwise, you can leave it blank.
Step 5: Select the brands you want to benchmark.
Use this field to search and select up to 21 brands that you want to include in the benchmark.
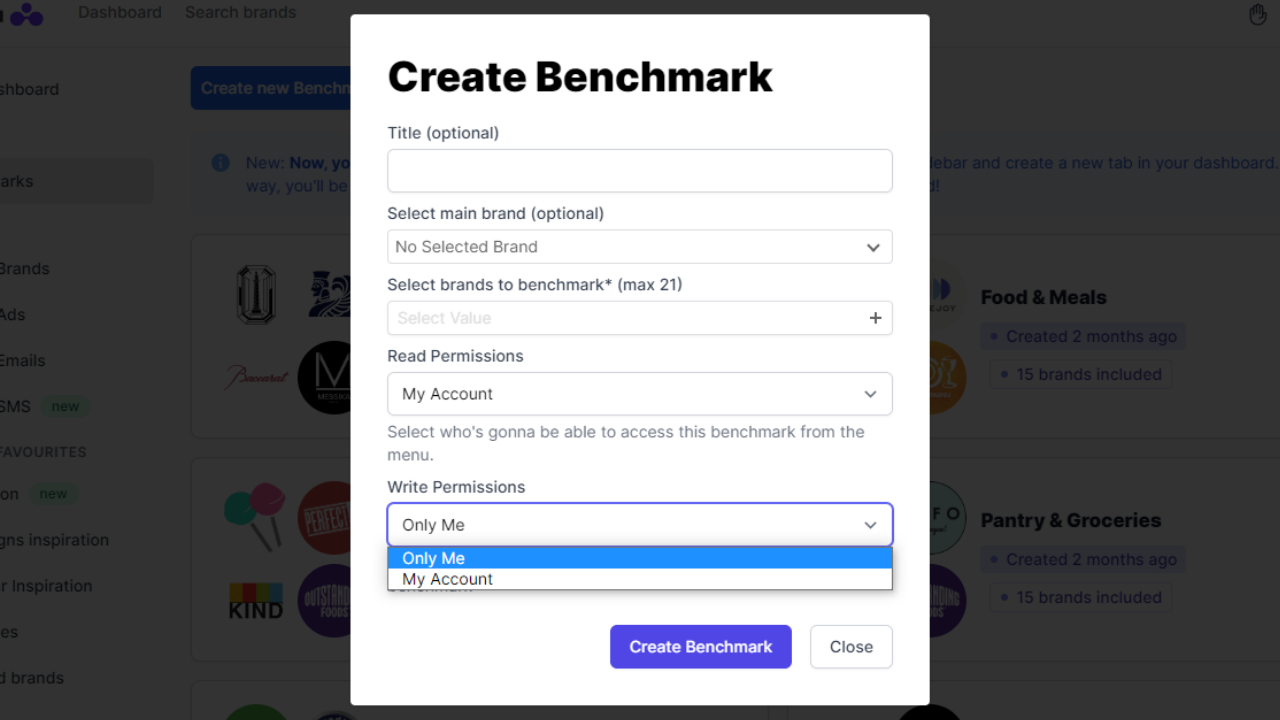
Step 6: Create your benchmark.
Once the fields are filled out, you can create the benchmark by clicking on “Create Benchmark”.
How to use a Panoramata benchmark
In a Panoramata benchmark, there are several sections with data on emails and ads to analyze the best practices and strategies of the benchmark’s brands in terms of email marketing and advertising.
Step 1: Select a period to analyze
Before reviewing the different sections of the benchmark, the first step is to select the period you want to analyze:
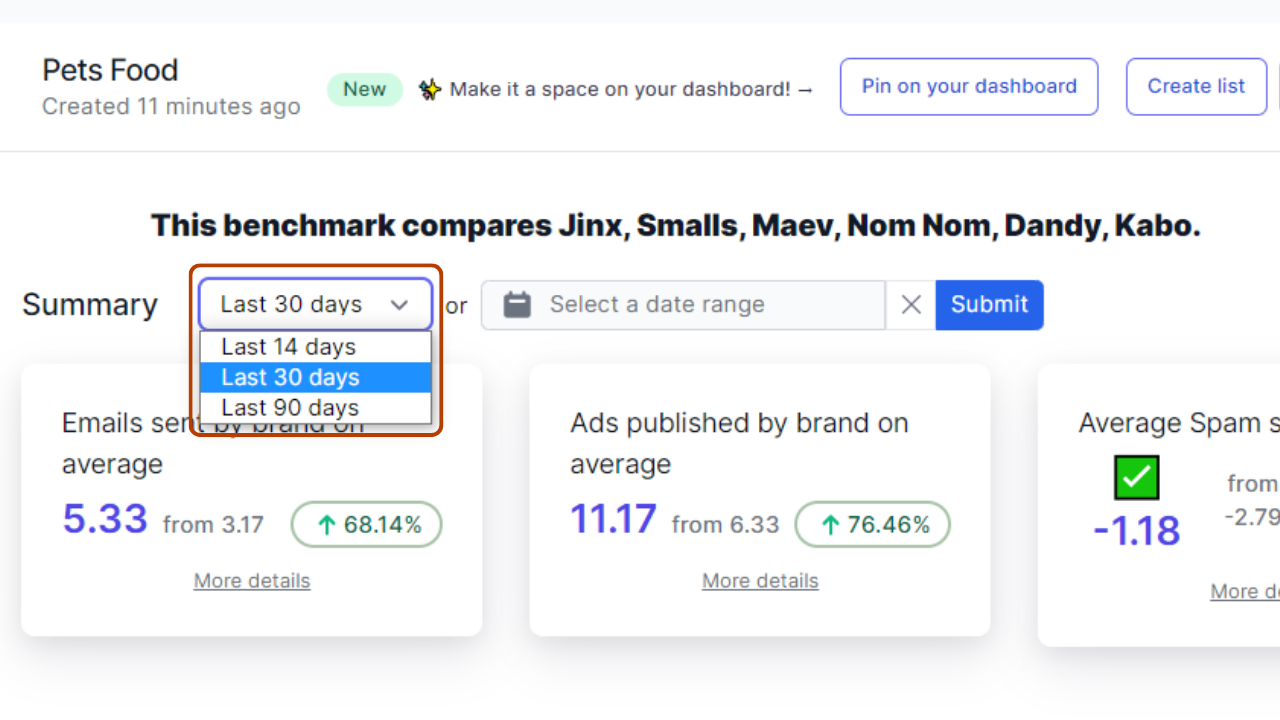
By default, the data displayed in a benchmark always covers the last 30 days. However, it is also possible to select between the last 14 or 90 days.
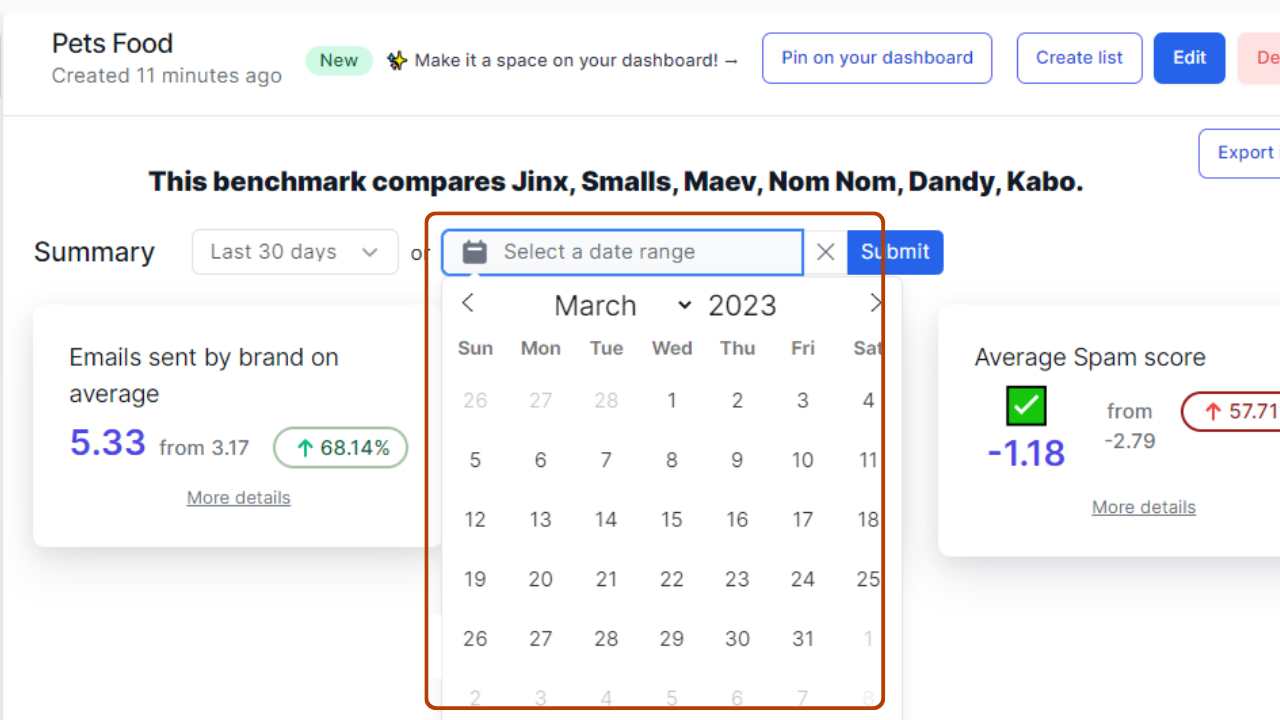
Additionally, you have the option to pick the date range of your choice and the changes in benchmark data will be displayed instantly. This customization feature enables you to tailor the analysis to your specific needs and gain better insights into trends over a shorter or longer period of time.
Step 2: View your competitors’ stats (emails, ads, and spam score)
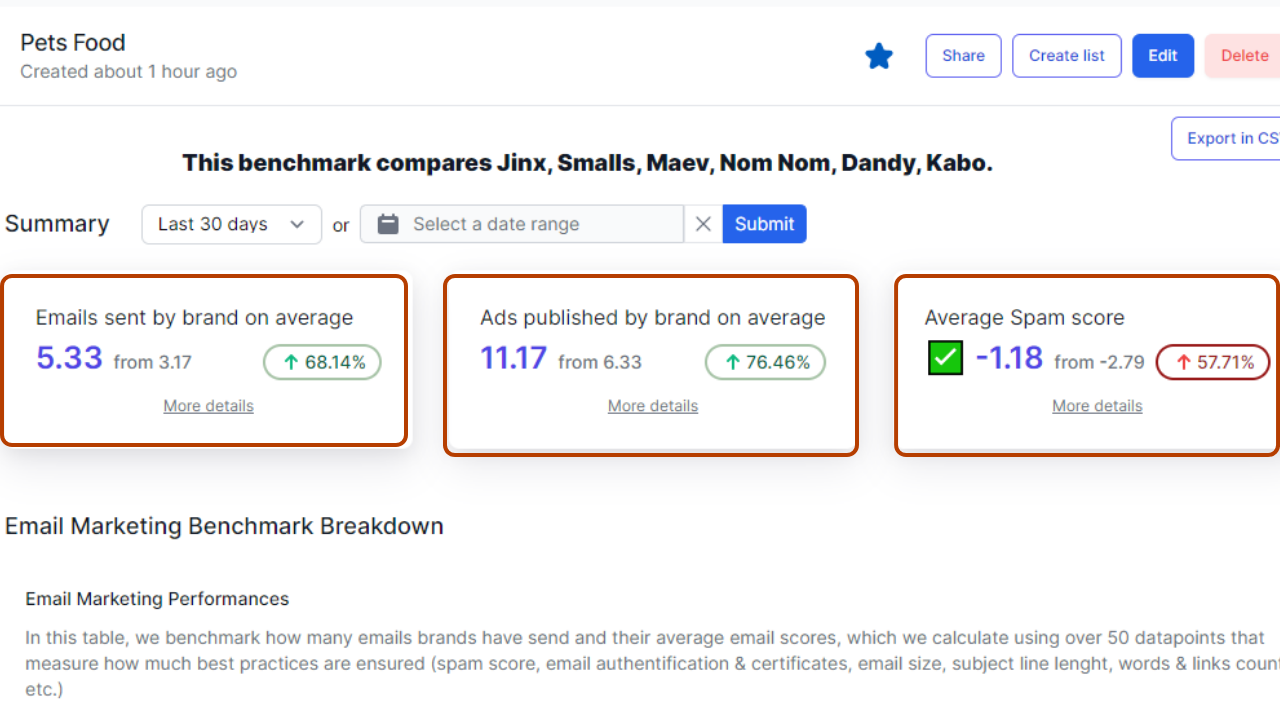
This section, which serves as a summary, is divided into three parts:
1. Emails sent by brand on average
This section displays the average number of emails sent by the selected brands.
2. Ads published by brand on average
This part indicates the average number of advertisements published by the selected brands.
3. Average spam score
This section displays the average spam score of the selected brands.
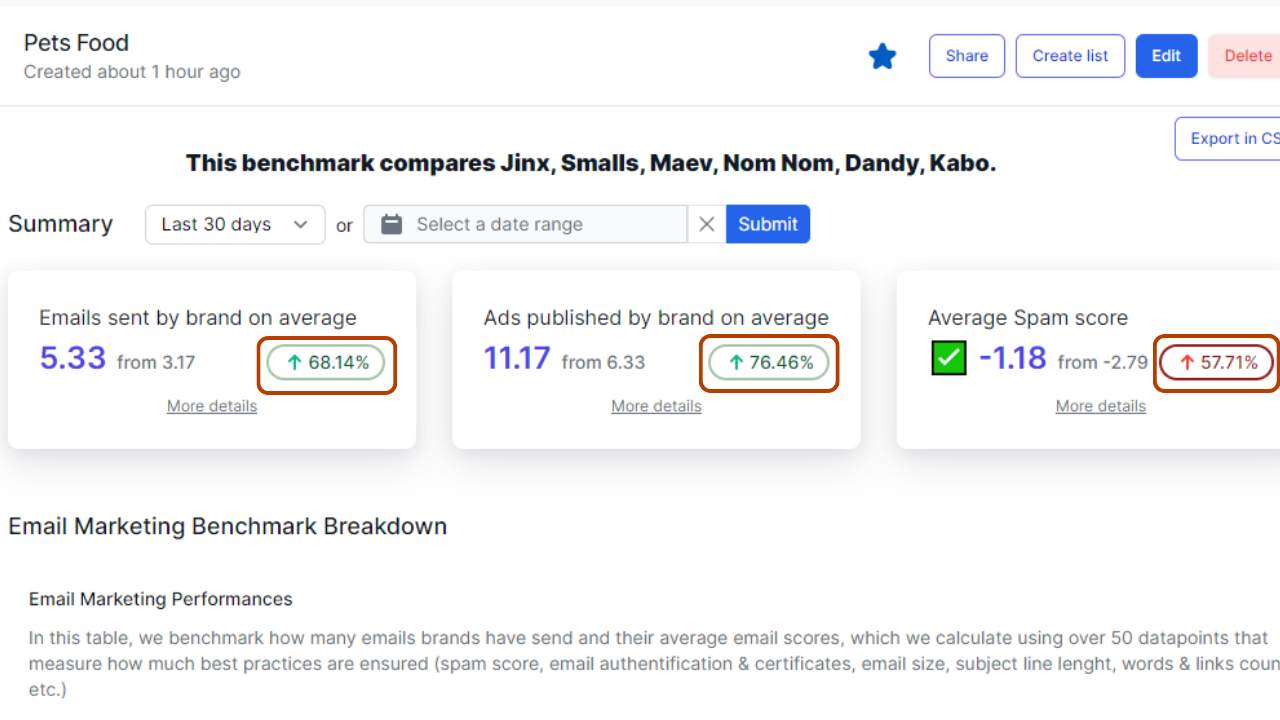
To the right of each section, you can see a percentage value that indicates either an increase (in green) or a decrease (in red) compared to the previous period.
Step 3: Analyze the Performance columns
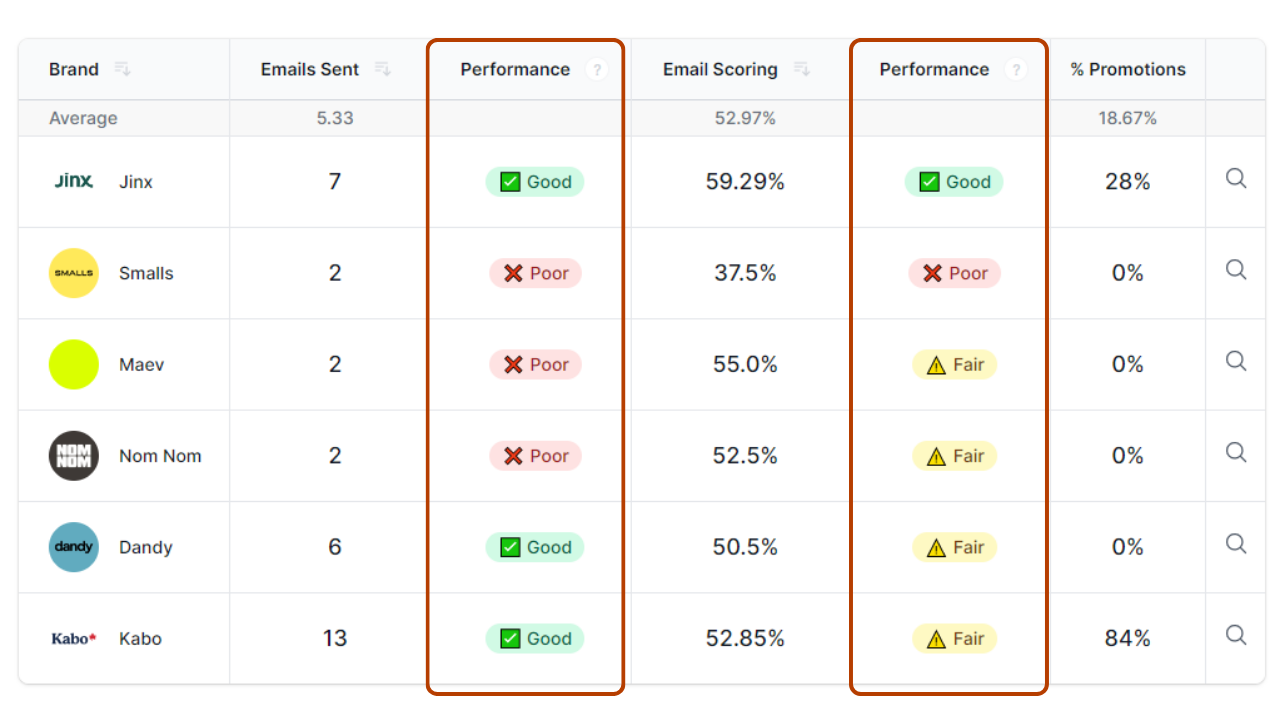
Before checking into each section of the benchmark in more detail, you may notice some columns labeled "Performance" are repeated in all benchmark tables.
These columns represent a classification relative to the average values of the selected brands:
- The performance is rated as "Good" if the brand has performed better than the average.
- The performance is rated as "Fair" if the value is equal or very close to the average.
- The performance is rated as "Poor" if the value is worse than the average.
Note: When it comes to the following metrics: "Emails Sent", "Email Scoring", "New Ads Detected", "Unique Copy", "New Images", and "New Videos", performing better means doing more than the average.
However, when it comes to the "Average Spam Score" of emails or "Email Size", performing better means having a value lower than the average.
Step 4: Sort the values in descending or ascending order
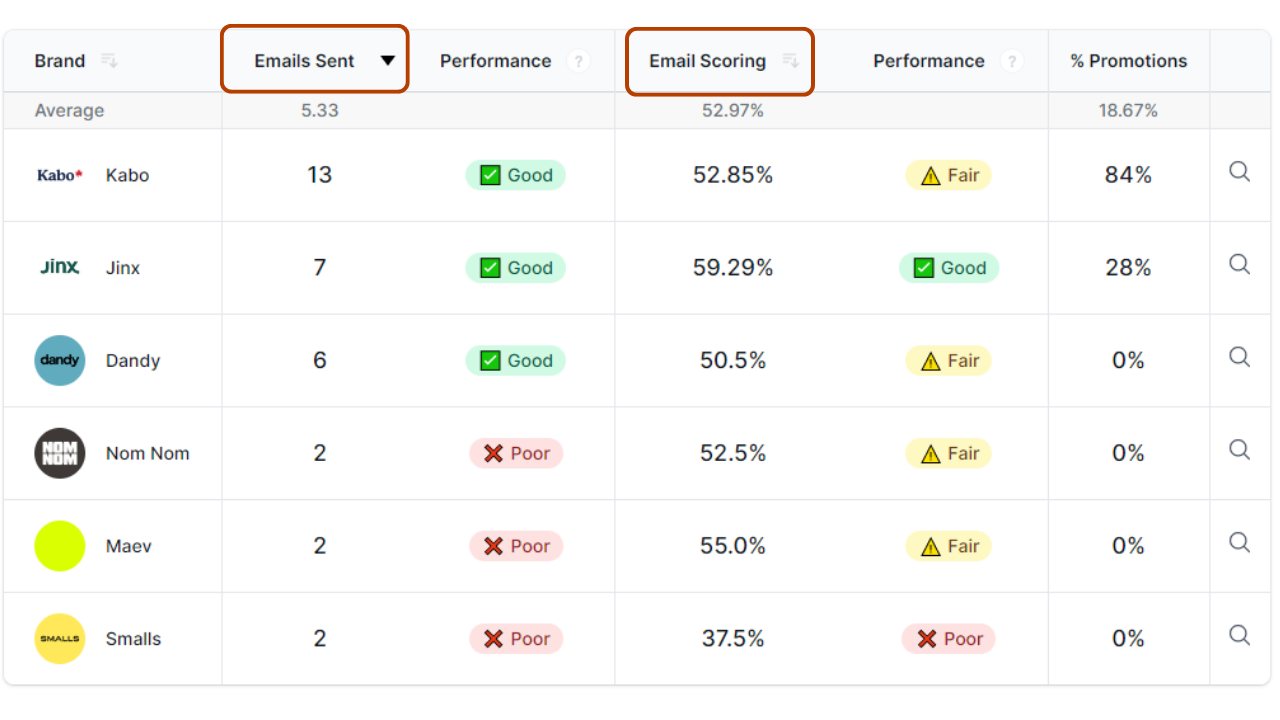
In all tables of the benchmark, you have the option to organize the display of values in descending or ascending order according to your needs.
In the table above, brands are displayed based on the number of emails sent, in descending order, by clicking on the column title "Emails Sent" or the icon next to it.
Similarly, you can sort the brands by email score in descending or ascending order, as well as sort the brands in alphabetical order in the "Brand" column in all benchmark tables.
You can switch between ascending and descending order values by clicking on the column header or the icon next to it.
Step 5: Look at your competitors' marketing stats on the email marketing and advertising benchmarks

The table displays the number of emails sent and the average email score of each brand.
This score is calculated based on more than 50 parameters such as spam score, email authentication and certificates, email size, length of email subject, number of words and links, and more.
Note: By clicking on the "Search" icon in the last right-hand column of the two tables related to emails, you will be redirected to the list of all emails sent by the corresponding brand during the benchmark reference period.
Email Marketing Benchmark Stats
Email Deliverability Performance
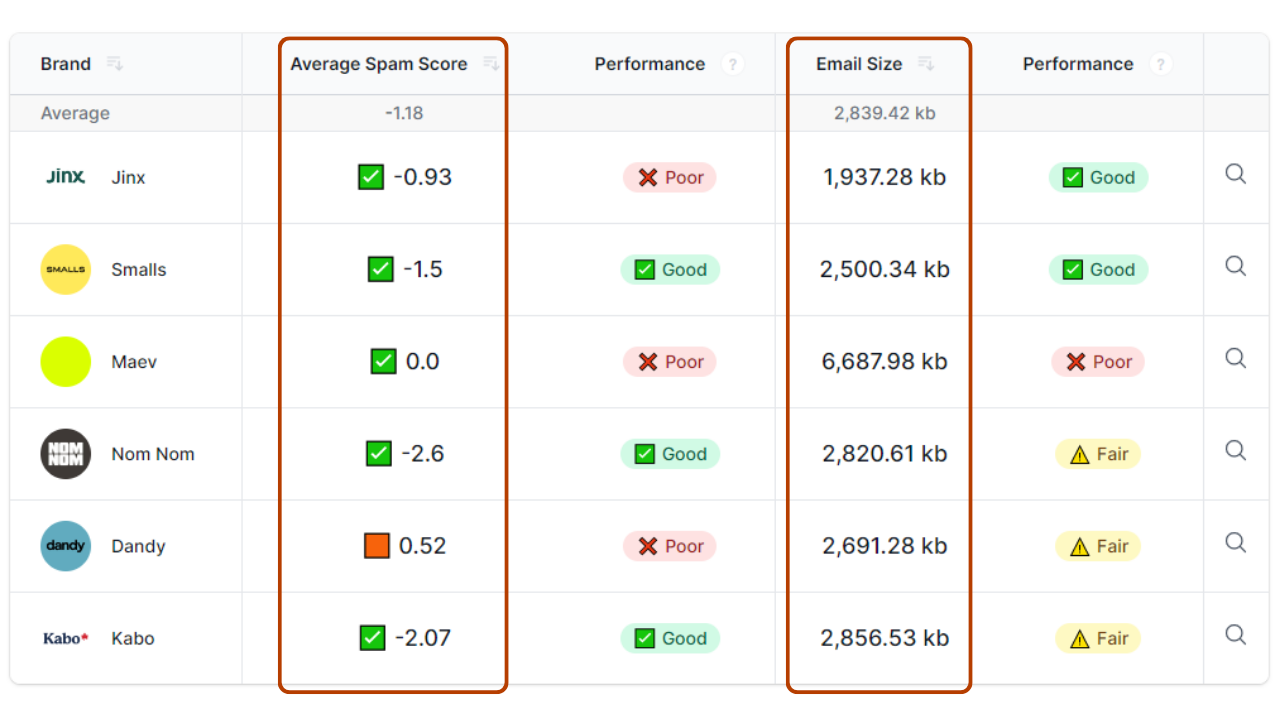
The table displays the average spam score and the average email size of each brand in the benchmark.
These two pieces of information help assess how optimized emails are for delivery and whether they are likely to pass anti-spam filters and not end up in the promotions tab.
Weekly Emails Sent on Average
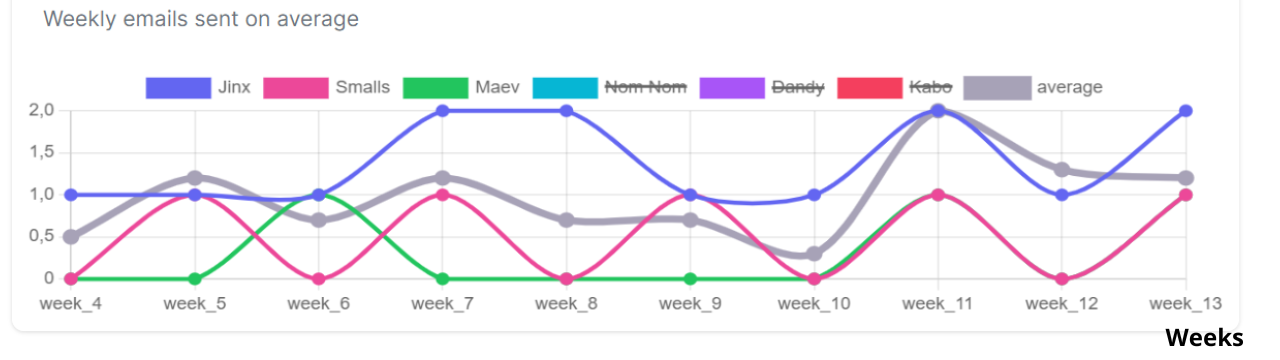
This section shows a graphical representation of the average number of emails sent by all benchmarked brands per week in gray, along with three curves representing the emails sent by three brands of the benchmark in different colors.
Ad Benchmark Stats
Ad Velocity and Performance
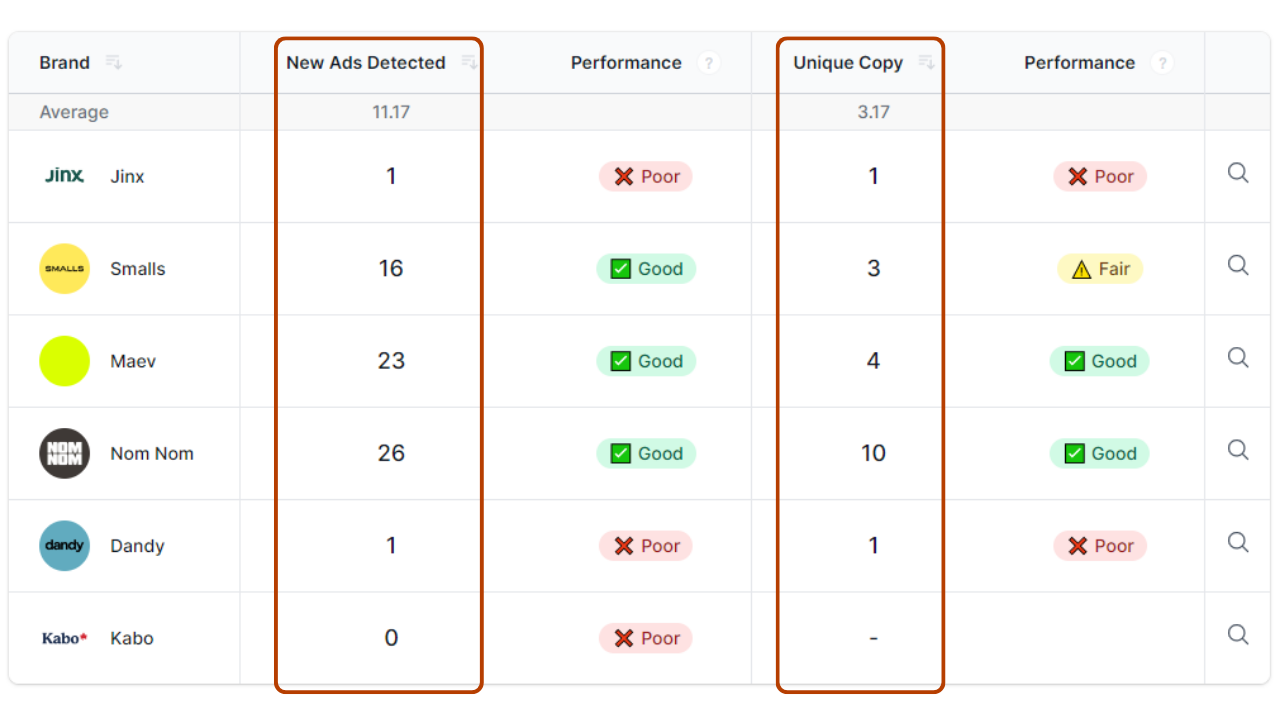
In this table, we compare the velocity and performance of brands - how many ads were published by the brand "New Ads Detected" and how many new unique ad copies were used "Unique Copy".
Social Ads Diversity
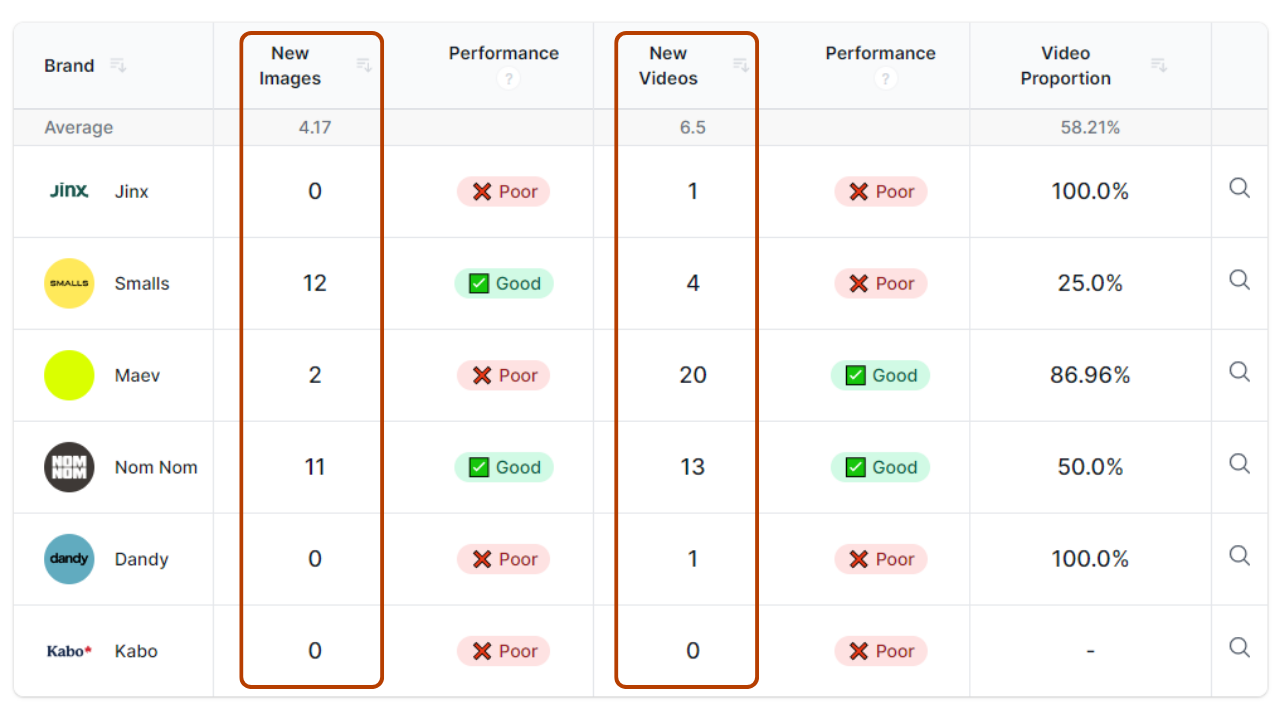
In this table, we compare the diversity of advertising assets used by brands on social media, focusing on the ratio between images and videos:
- New Images: The number of new images used in recently detected ads.
- New Videos: The number of new videos used in recently detected ads.
Please note that, as with the email tables, by clicking on any of the small "search" icons in the last column on the right of each row, you will be redirected to the list of detected ads for the corresponding brand during the predefined benchmark period.
Weekly Ads Created on Average
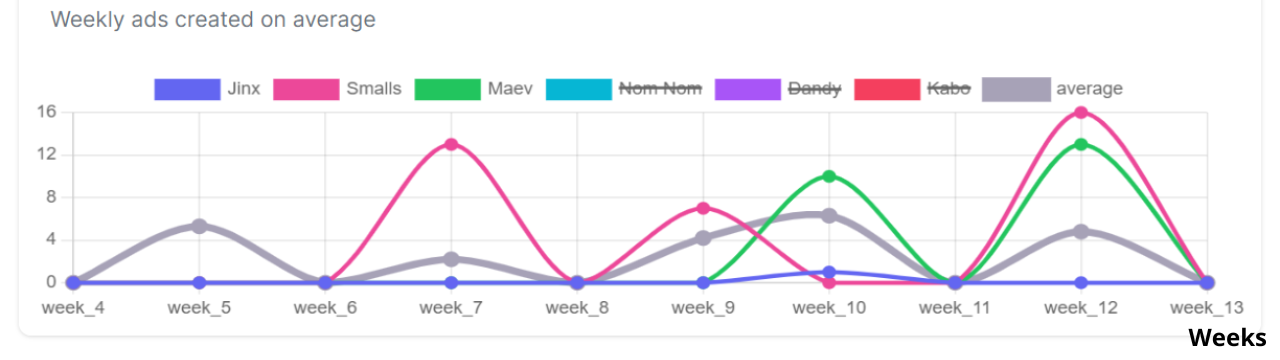
This section shows a graphical representation of the average number of ads published per week by all benchmarked brands in grey, along with three curves representing the number of ads published per week by only three brands of the benchmark in different colors.
This visualization enables the comparison of the advertising performance of these three brands against the benchmark average.
Step 6: Track your benchmark on your dashboard, share it, or create a list for your benchmark
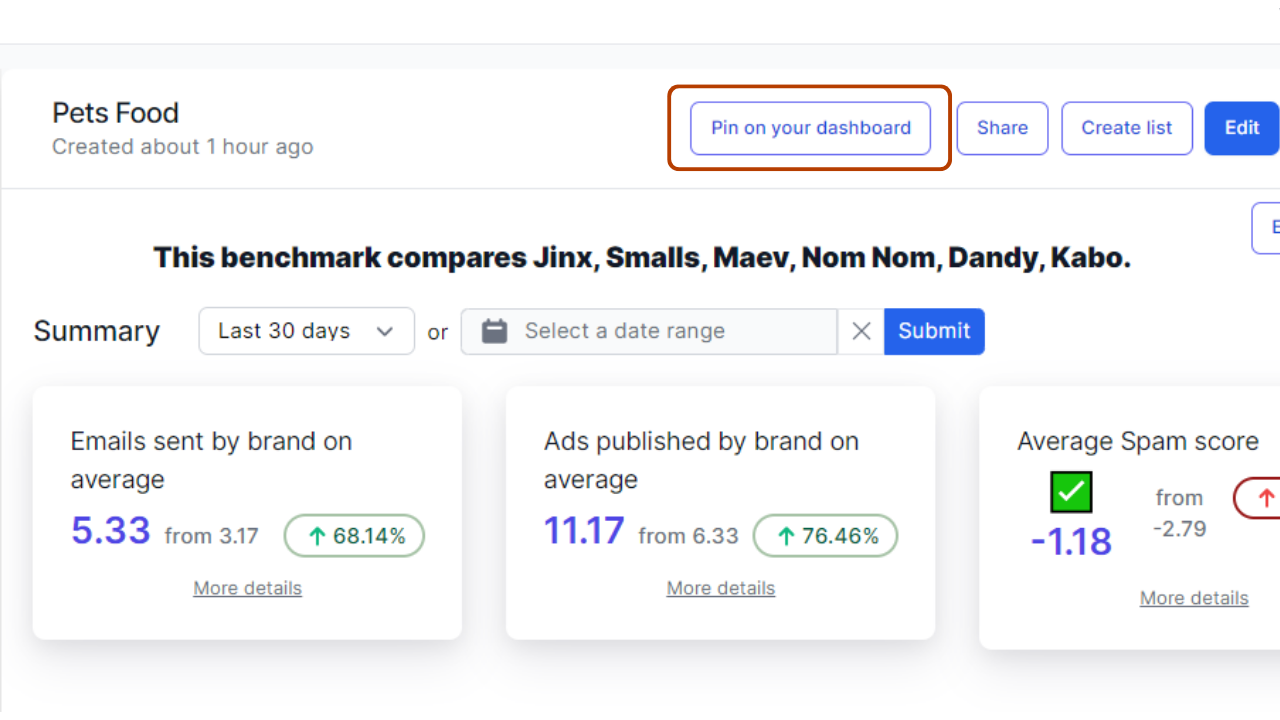
How to Pin a Benchmark
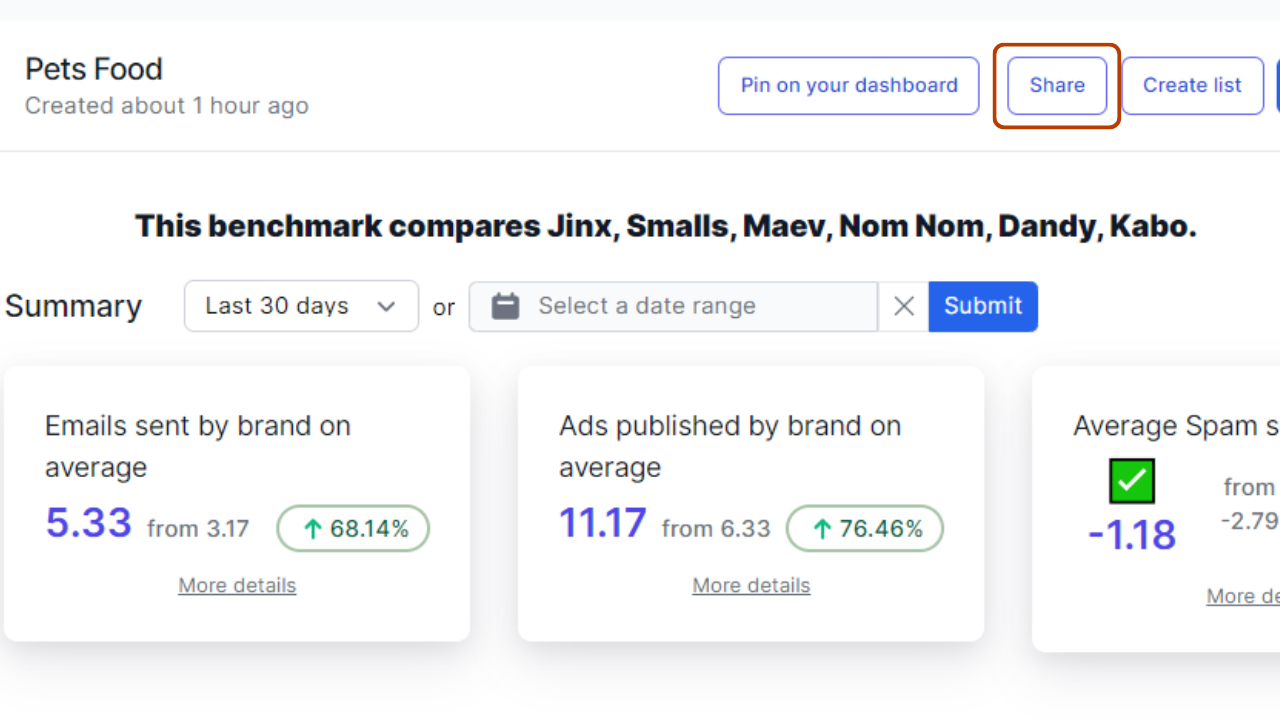
Once the benchmark is created, you can pin it to your dashboard by clicking on "Pin on your dashboard" located at the top right of the benchmark page.
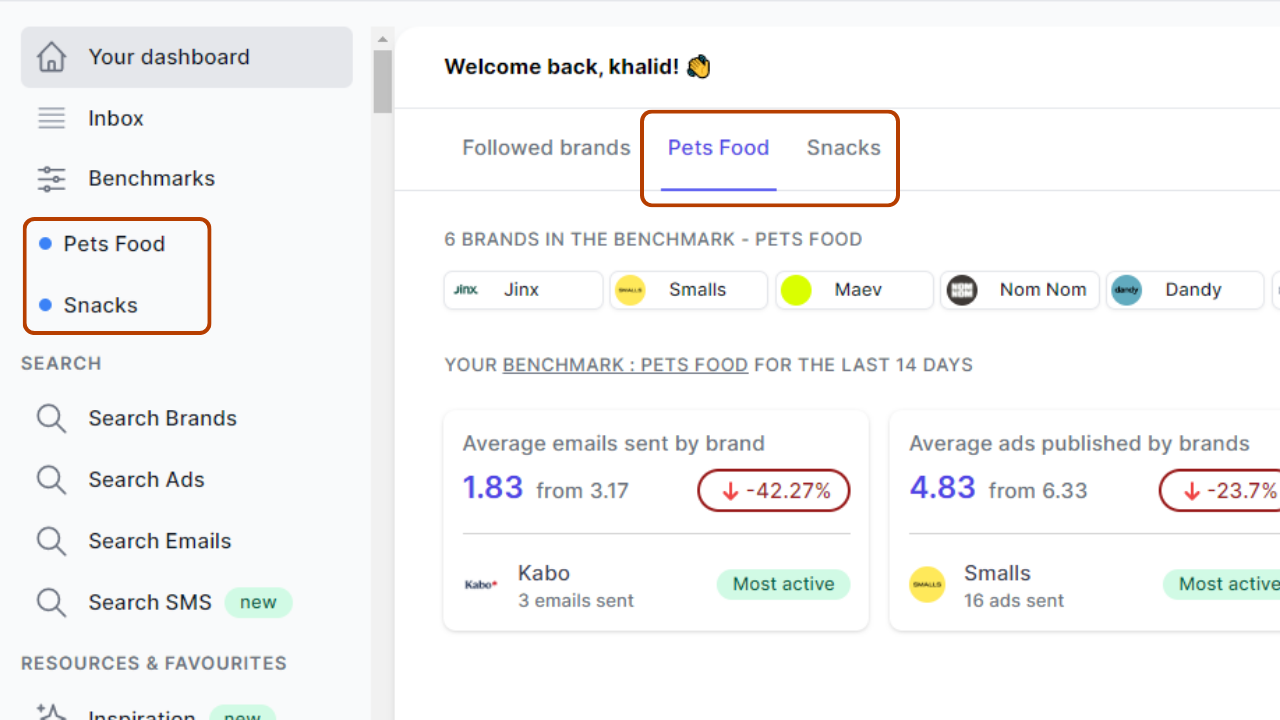
Assuming you have created three benchmarks titled: Pets Food, Luxury (Jewelry/Watches), Food & Meals and Snacks.

If you want to access the latest data of pet food and snack benchmarks from your dashboard, you can open each of the two benchmarks and click on "Pin on your dashboard".
This will generate a tab for each benchmark, allowing you to view data for the last 14 days without leaving your dashboard.
Additionally, both benchmarks will also appear in the left menu at the bottom of "Benchmarks".
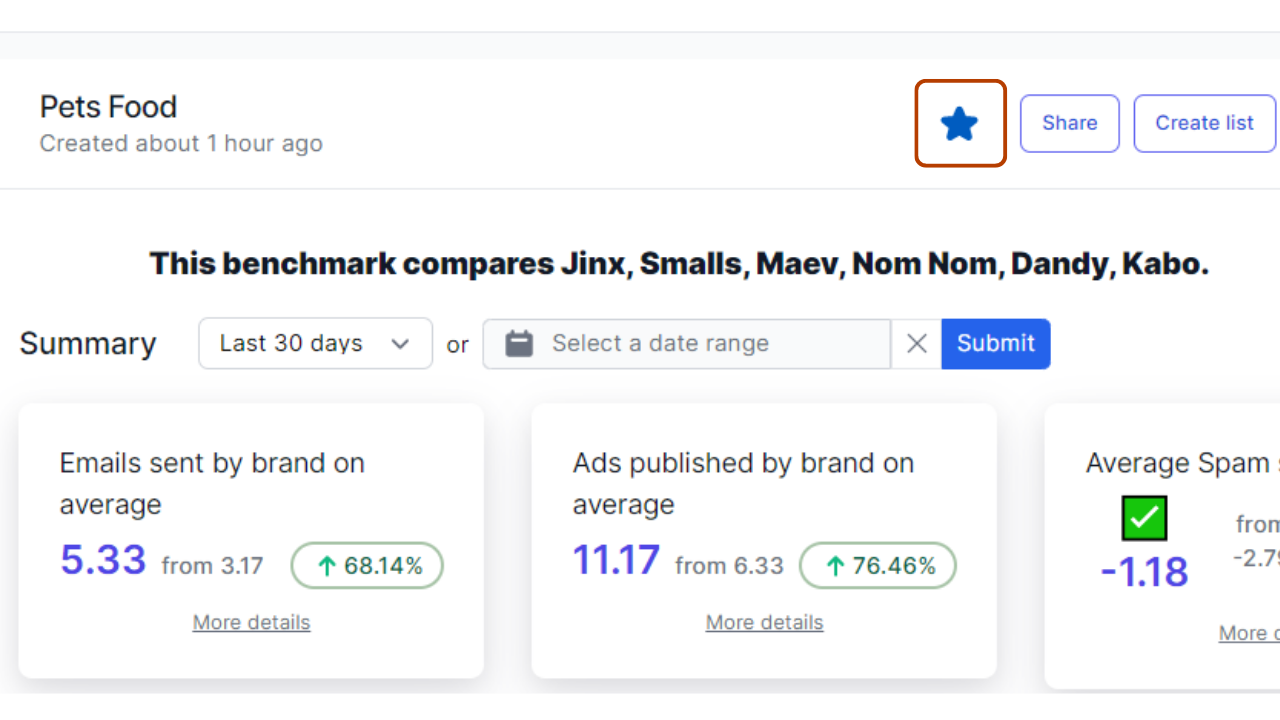
If you no longer want a benchmark tab on your dashboard, you need to open the relevant benchmark and click on the star icon located in the top right corner next to the “Share” button.
How to Share a Benchmark
To share the URL of a benchmark, click on the "Share" button and the URL will be automatically copied.
How to Create a List Within a Benchmark

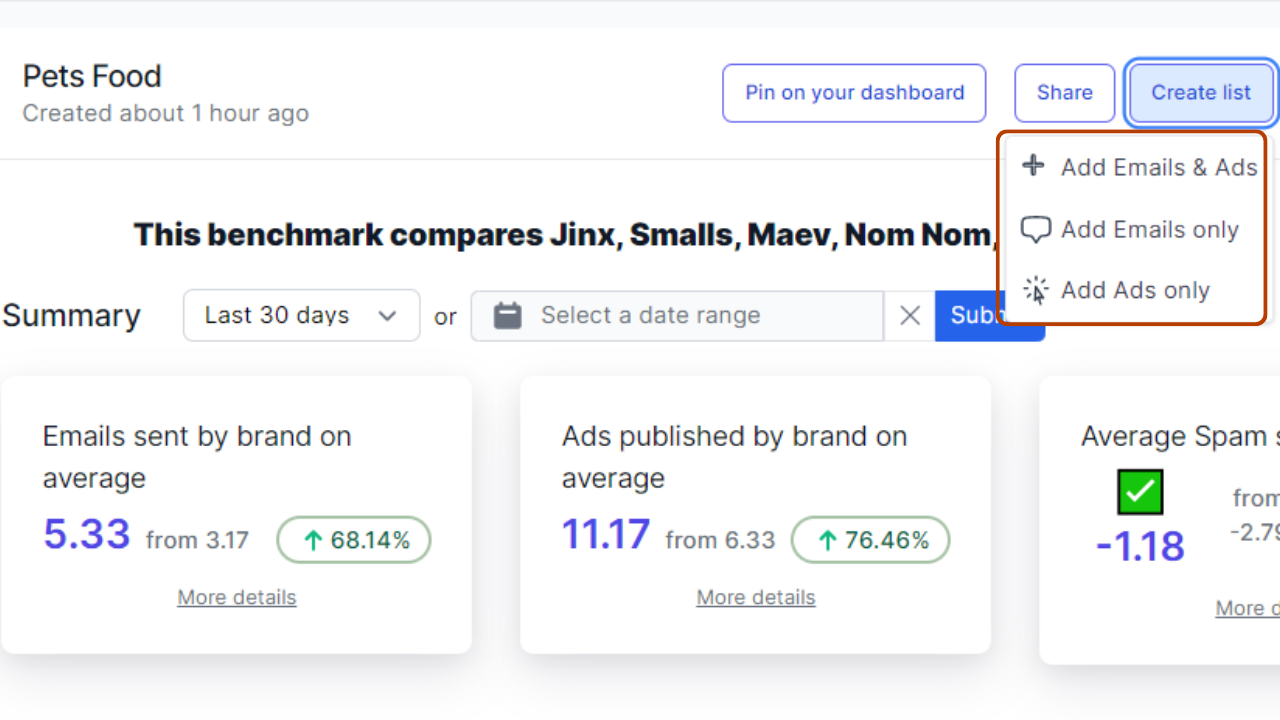
To create a list of emails and/or ads specific to a benchmark, click on the "Create list" button and you will have three options:
- Create a list of all the emails sent and ads launched by the brands during the predefined benchmark period by clicking on "Add Emails & Ads".
- Create a list of all the emails sent by the brands during the predefined benchmark period by clicking on "Add Emails only".
- Create a list of the ads launched by the brands during the predefined benchmark period by clicking on "Add Ads only".
Stay competitive with benchmarking
Benchmarking your brand against competitors is a powerful strategy to gain clarity and drive growth. By regularly comparing your performance using well-defined KPIs and industry benchmarks, you can uncover critical insights that inform your decision-making and keep you ahead of the curve.
Embrace this process, and you'll be well-equipped to refine your strategies, enhance your strengths, and ultimately, achieve greater success in your market.
Ready to start your own competitive analysis? Grab your free competitive analysis template below. If you’d like to learn more about Panoramata, book a demo with us or take it out for a spin by signing up here.
Frequently Asked Questions
How often should you benchmark performance?
Benchmarking performance should ideally be done on a regular basis, such as quarterly or biannually. The frequency depends on your industry dynamics and how rapidly changes occur in your market. Regular benchmarking ensures that you stay updated on your competitive position and can promptly adjust your strategies.
Are KPIs the same as benchmarks?
No, KPIs (Key Performance Indicators) and benchmarks are not the same.
KPIs are specific metrics that measure your performance against business goals, while benchmarks are standards or points of reference used to compare your performance against competitors or industry averages. Both are essential tools, but they serve different purposes in evaluating and improving business performance.


