

Dashboards, benchmarks, and lists are used for different things in Panoramata. Dashboards help you follow activity. Benchmark reports help you compare companies. Lists help you keep examples you want to reuse later.
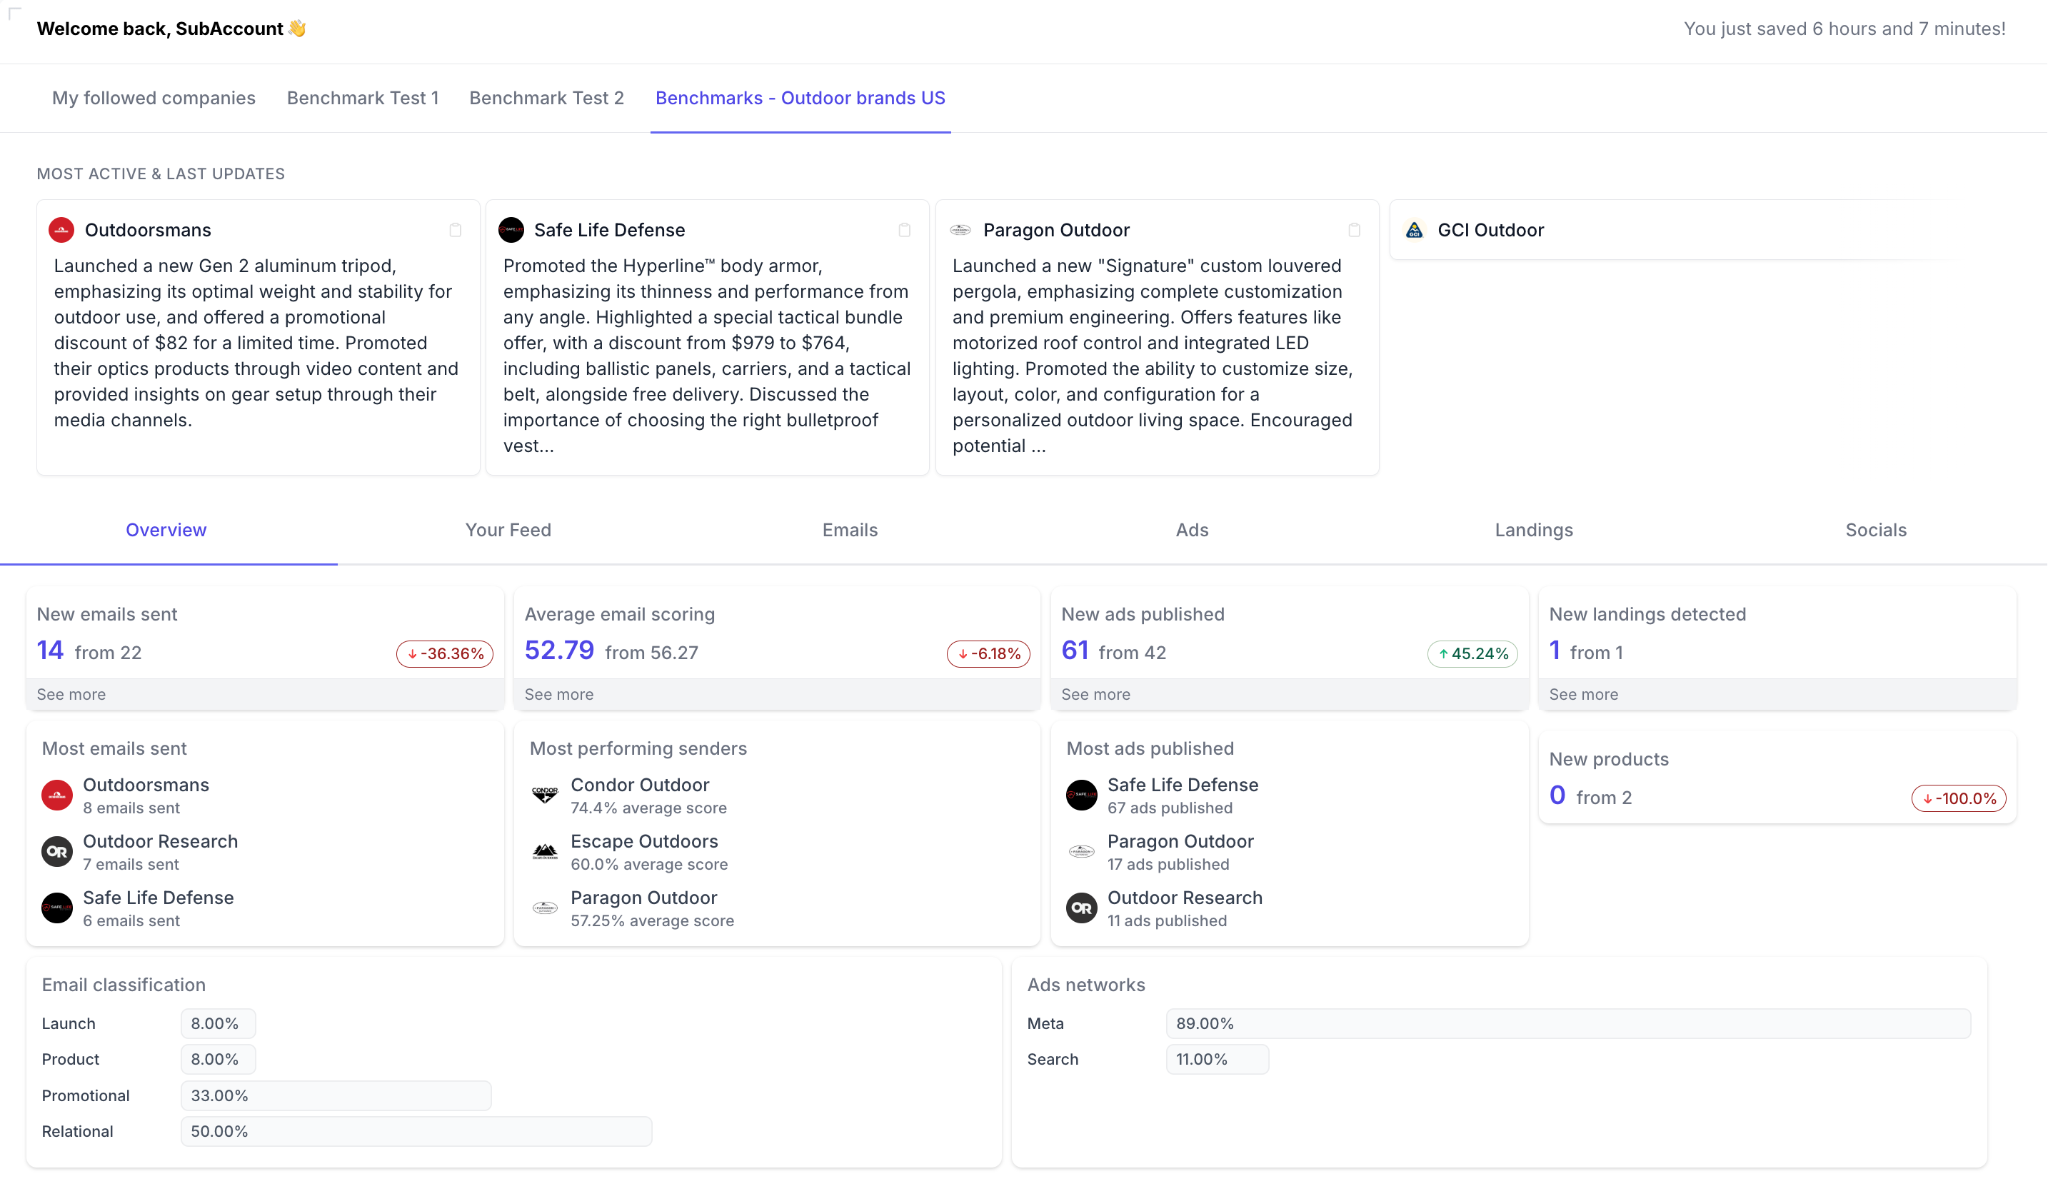
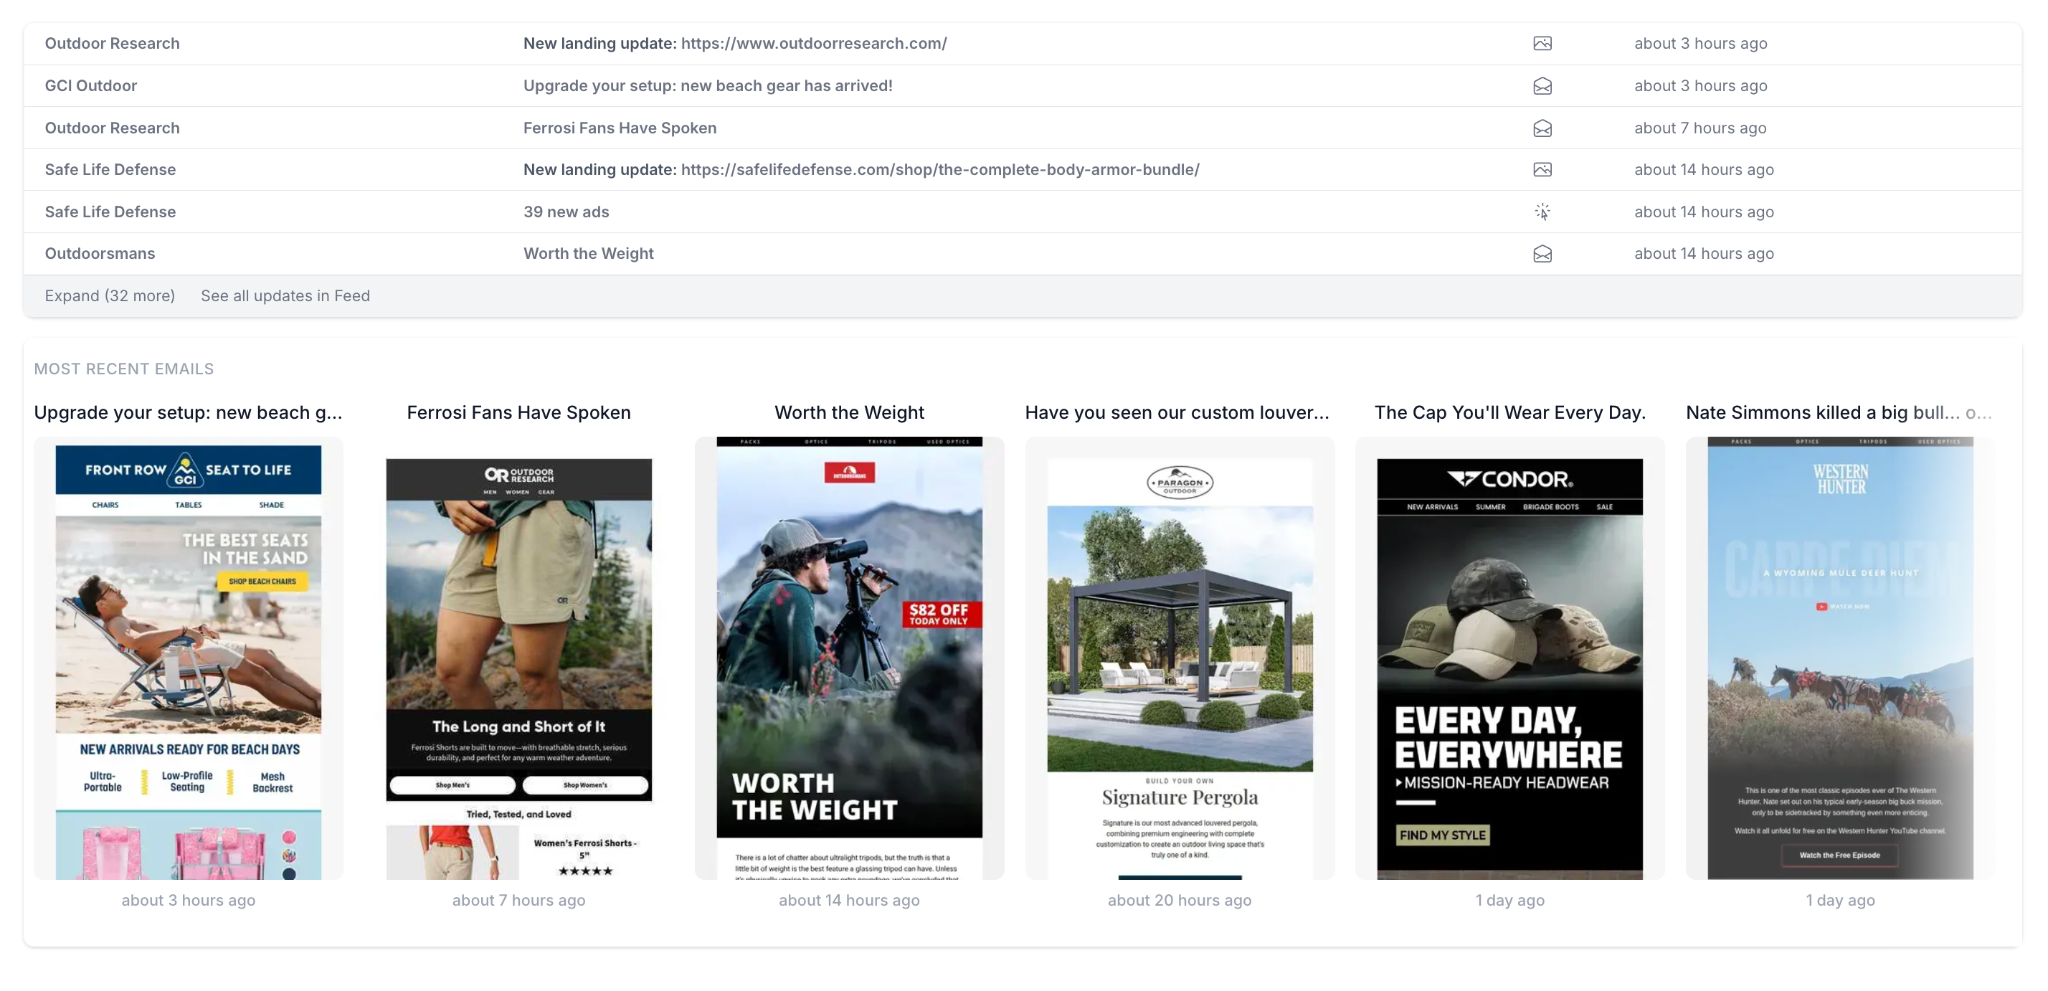
A dashboard is the place where you review what a group of brands is doing.
Use it to monitor recent activity across channels, such as ads, emails, landing pages, or social posts.
It is useful when you want an overview, instead of opening each brand one by one. For more detail, read: What does the Dashboard track?
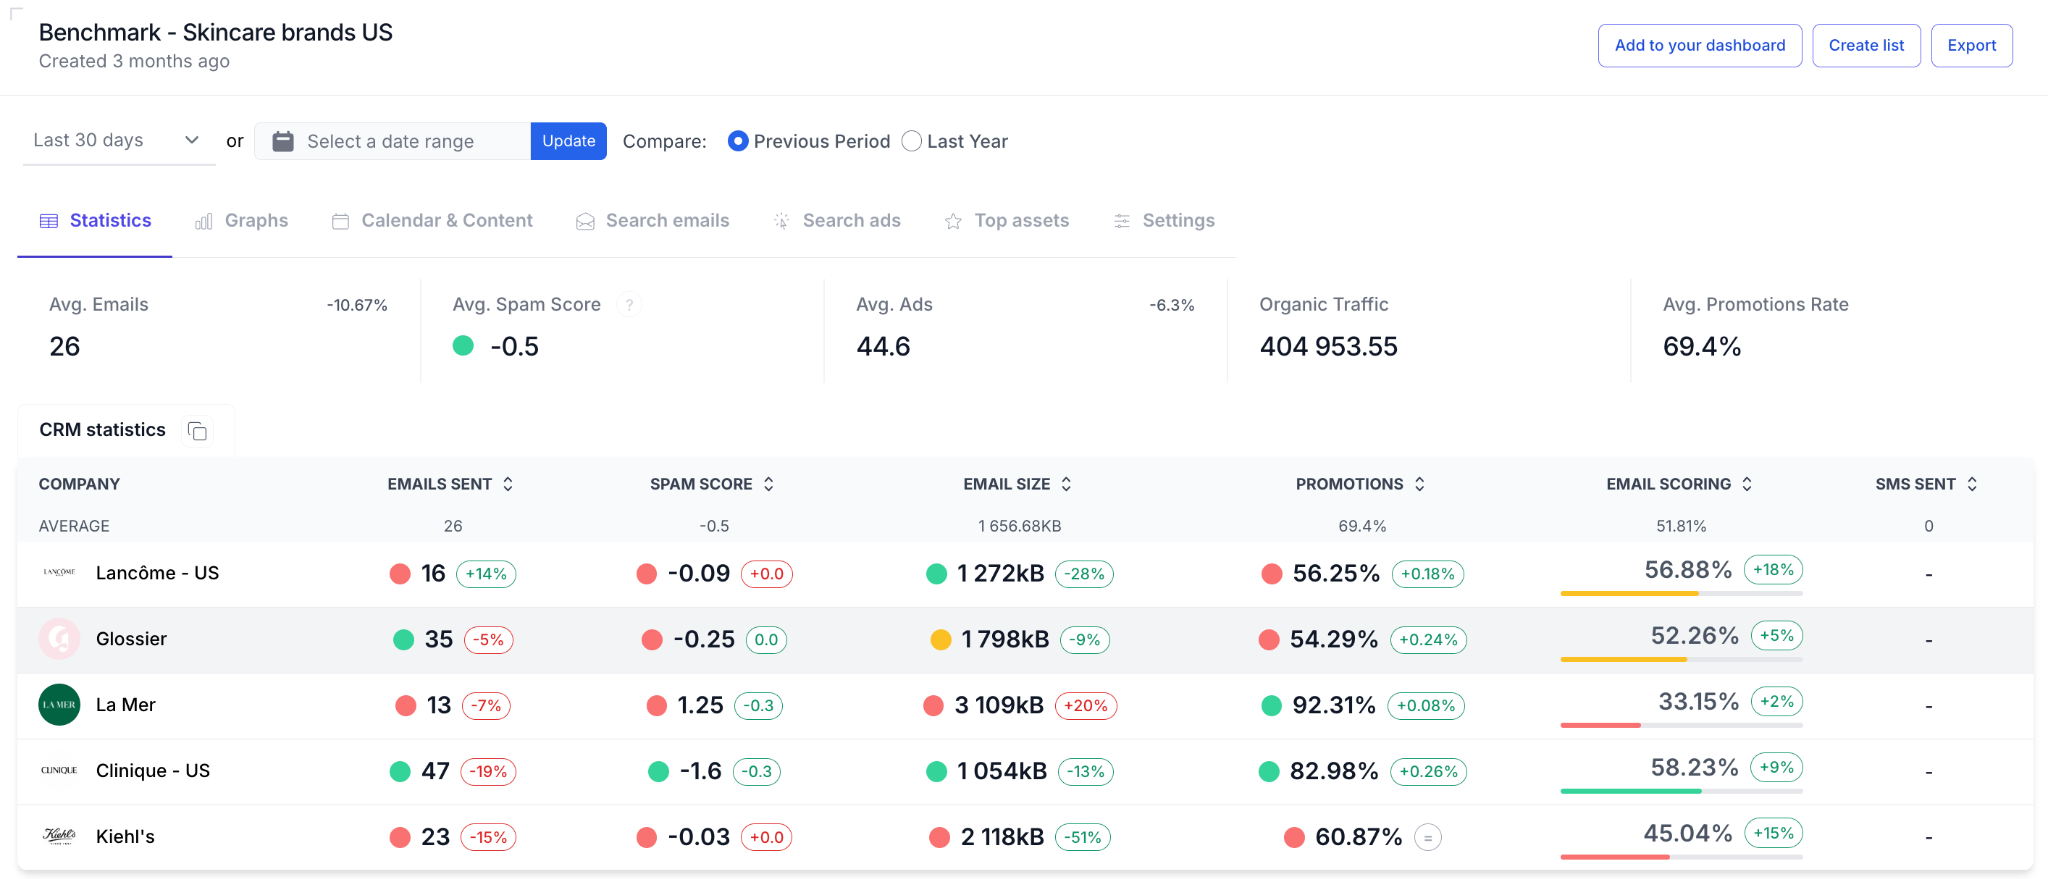
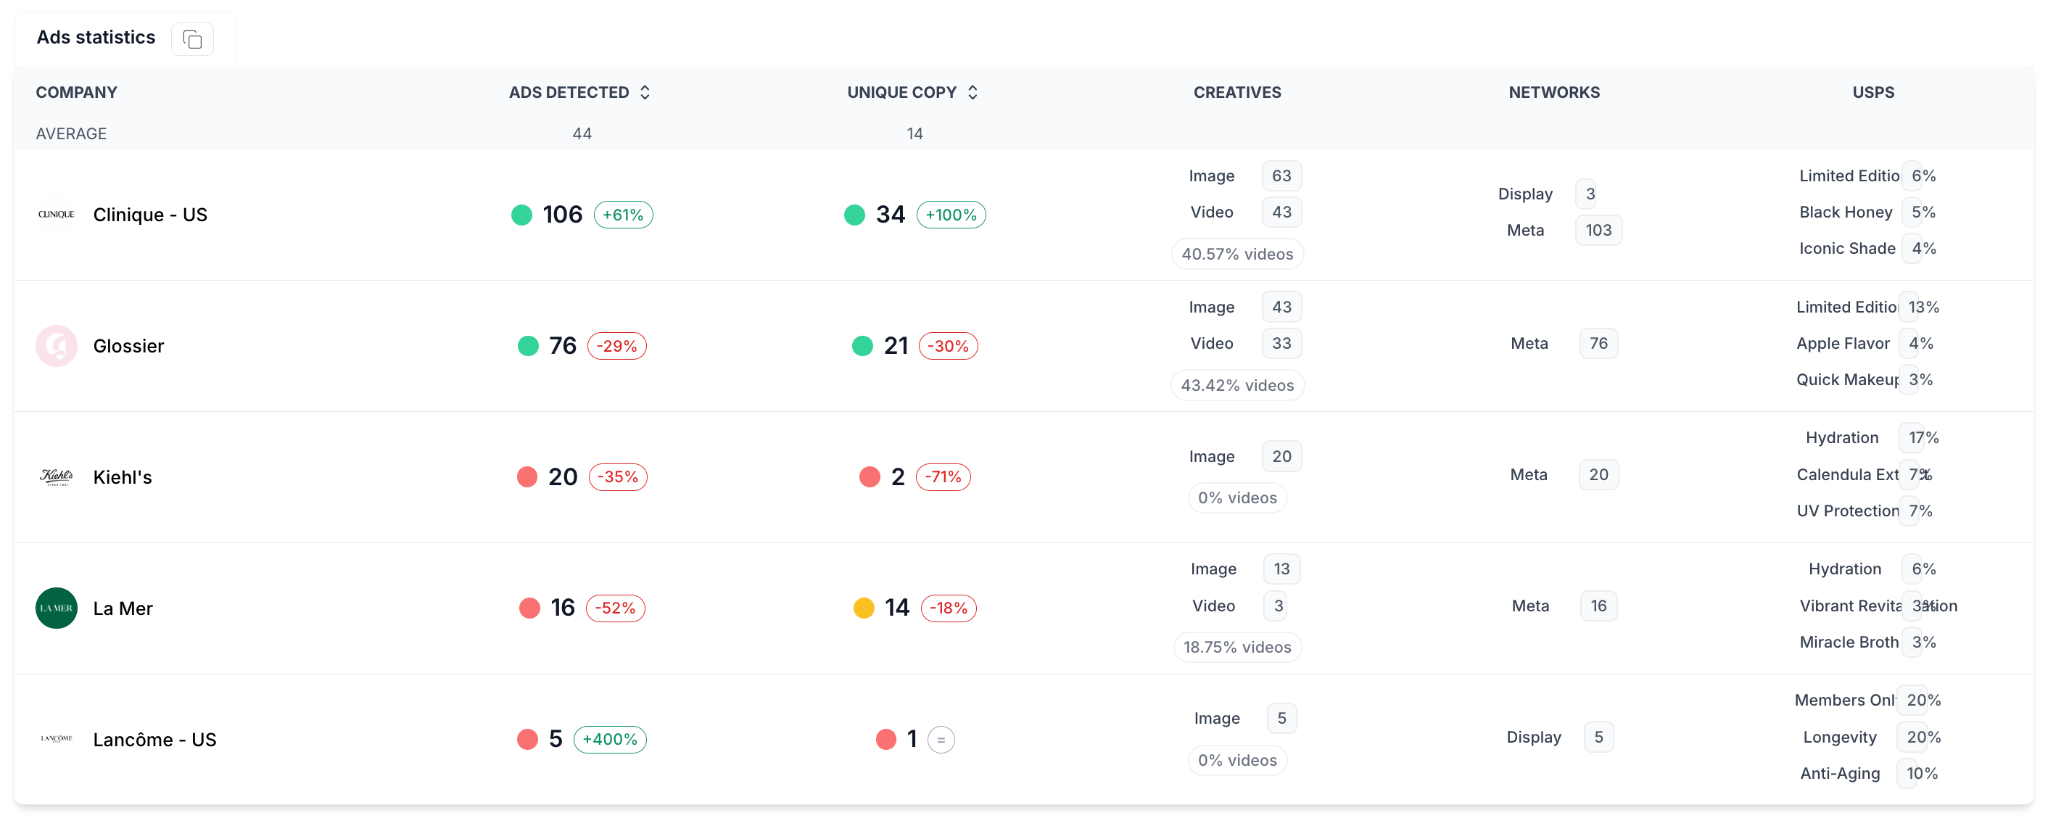
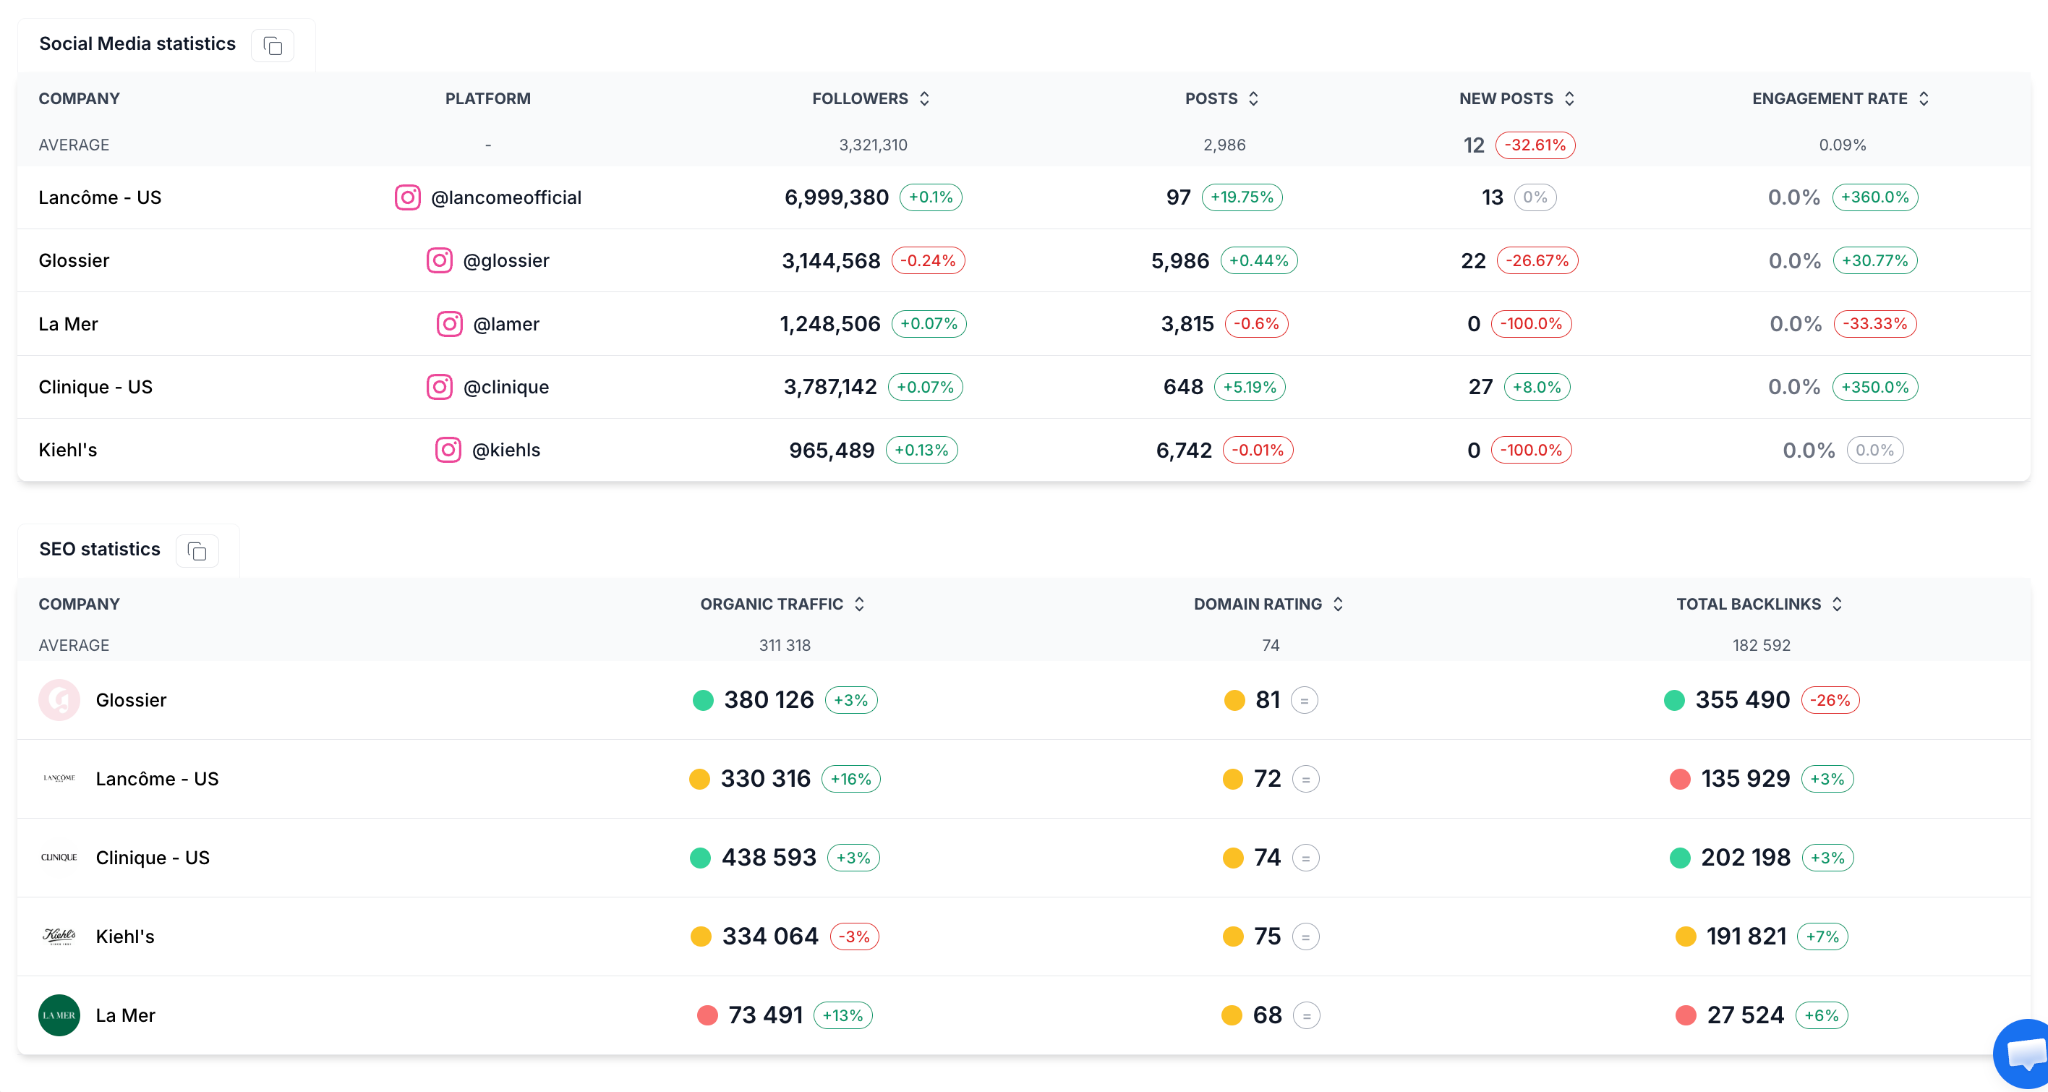
A benchmark is a group of companies you want to track or compare together.
Use benchmarks to organize competitors by client, market, country, industry, or competitor set.
For example, an agency can create one benchmark for each client or project.
To understand the relation between benchmarks and dashboards, read: Can I create multiple dashboards?
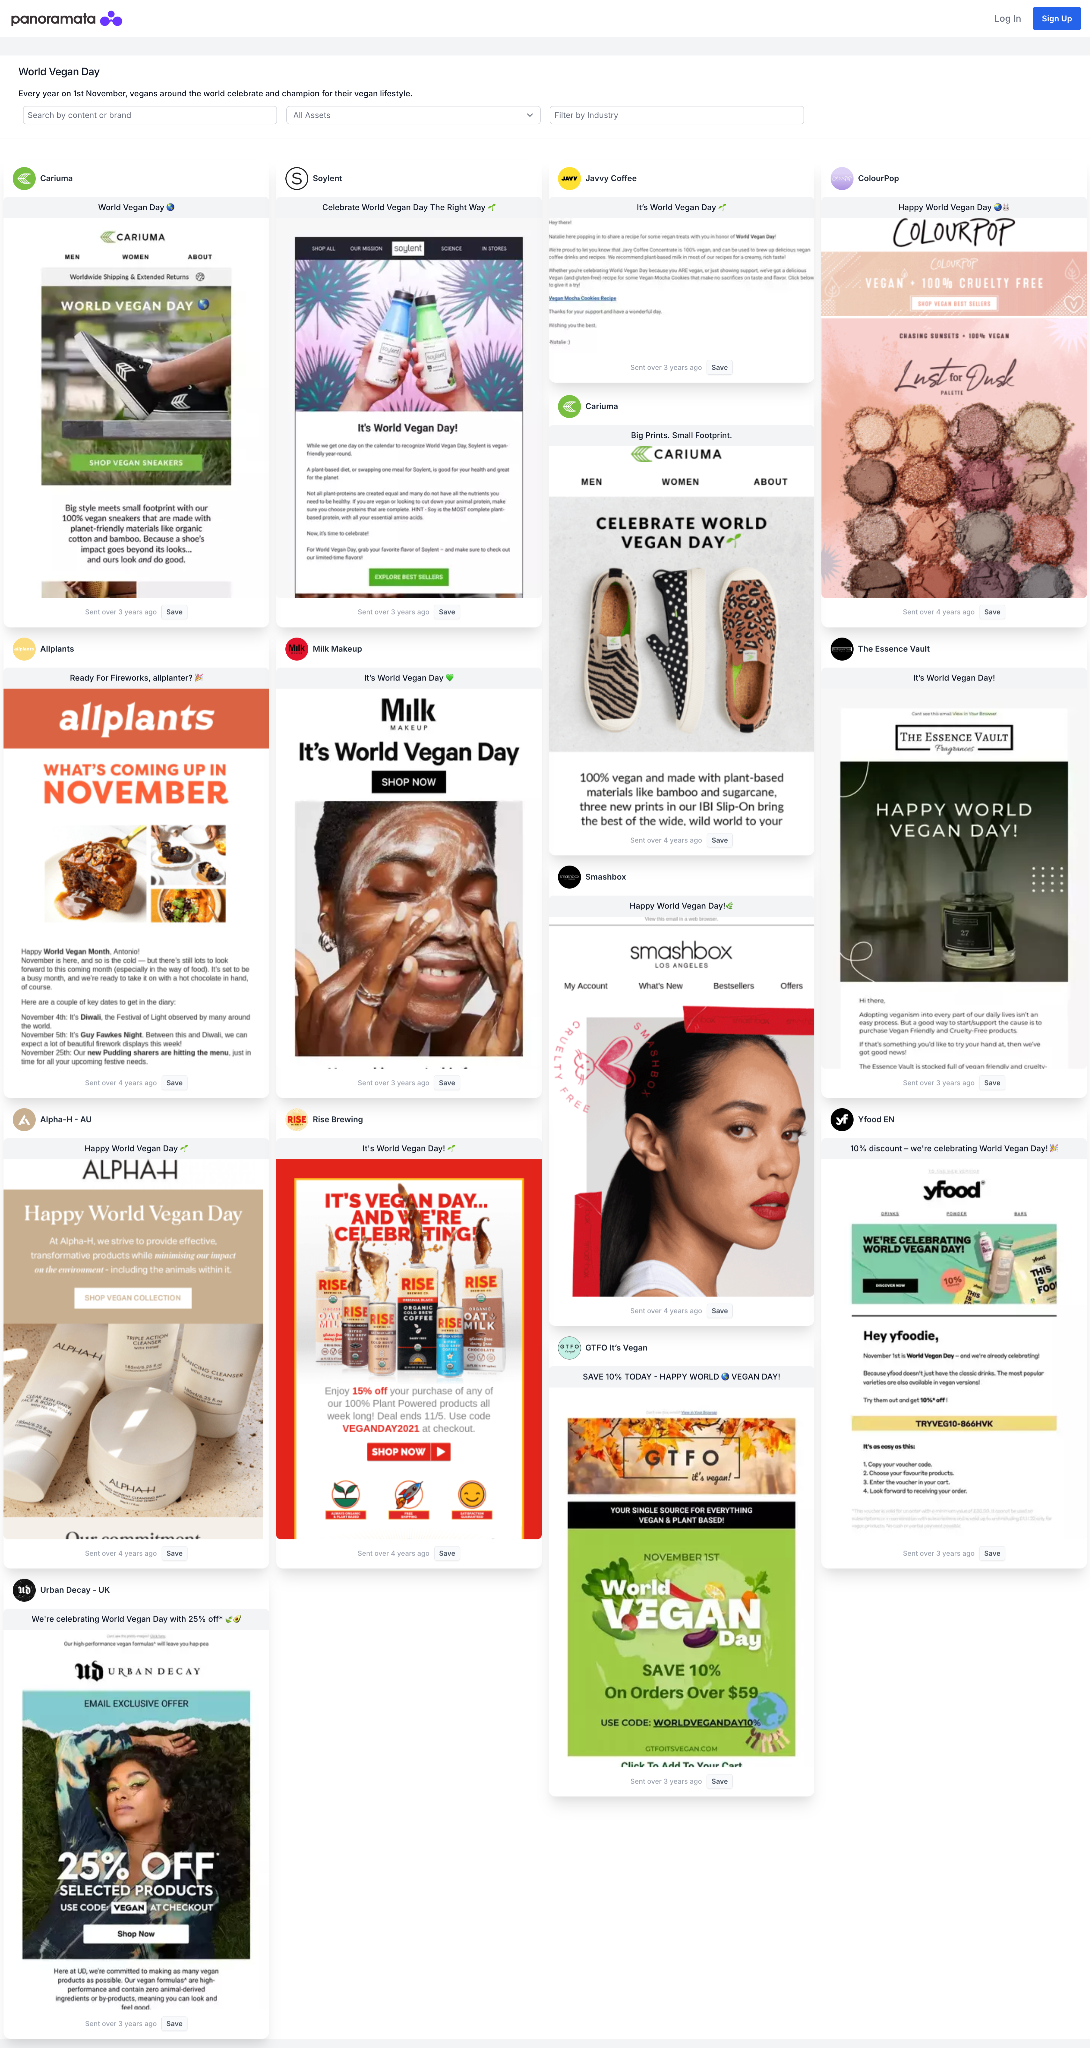
A list is for saved assets, not companies.
Use lists when you find an ad, email, landing page, or creative example you want to keep for inspiration, reporting, or sharing with your team or clients.
To learn how lists work, read: How can I save the creatives that I like?


1-minute signup, no credit card required
with our experts


